Super Typhoon Ragasa is currently tracking west-northwest across the northern Philippines and into the South China Sea, with sustained winds exceeding 130 knots at peak intensity. Forecasts from the Joint Typhoon Warning Center show it maintaining super typhoon strength as it approaches the southern China coastline near Hong Kong and Guangdong around September 24, before weakening over northern Vietnam. This trajectory takes it directly across one of the busiest LNG shipping corridors in Asia. The South China Sea is a vital route for cargoes coming from Australia, Qatar, and Southeast Asia heading to key buyers such as China, Taiwan, and Japan, and the presence of such an intense system will force LNG carriers to reroute, delay sailings, or idle at safer anchorage points until the storm passes.
Operationally, ports and LNG import terminals in southern China—including those near Shenzhen, Zhuhai, and Hong Kong—are likely to halt activity temporarily due to safety concerns, which could delay offloading and disrupt short-term scheduling. This creates a cascading effect: charter rates may rise, congestion could build up at alternate ports such as Singapore or Subic Bay, and some buyers may face short-term supply tightness. From a market standpoint, the disruption risk adds upward pressure to spot LNG prices, especially in a period of already high seasonal demand. Even if the storm weakens before final landfall, its broad wind field and heavy seas will still impact vessel operations in the region for several days.
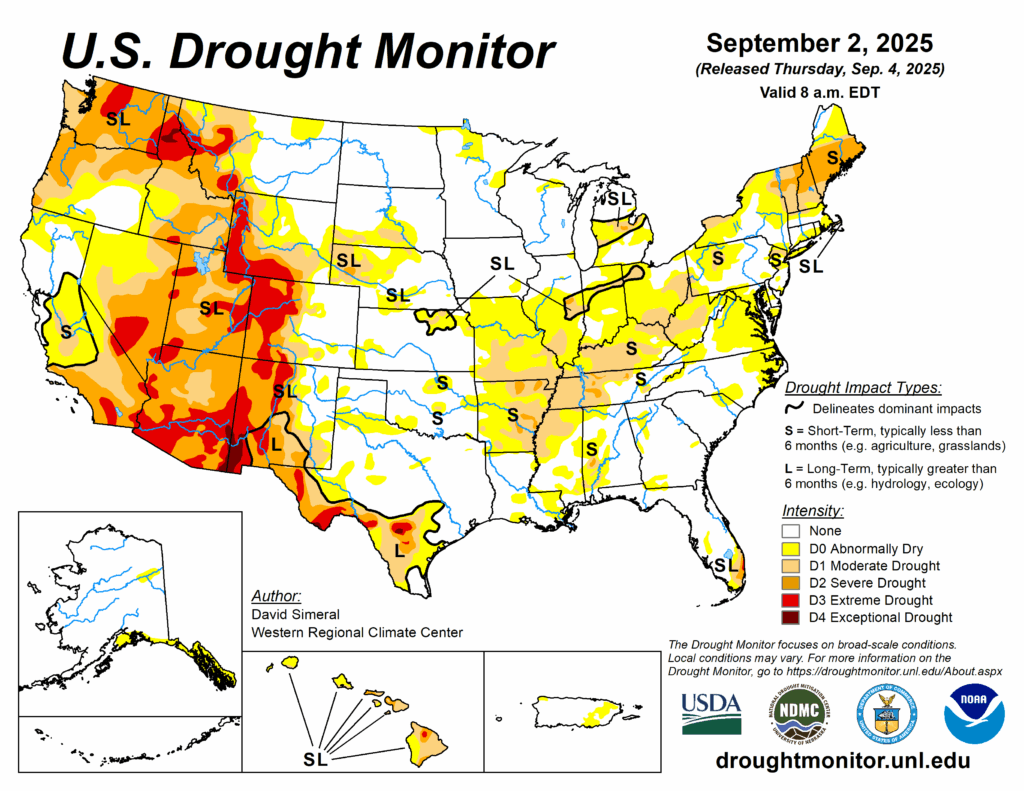
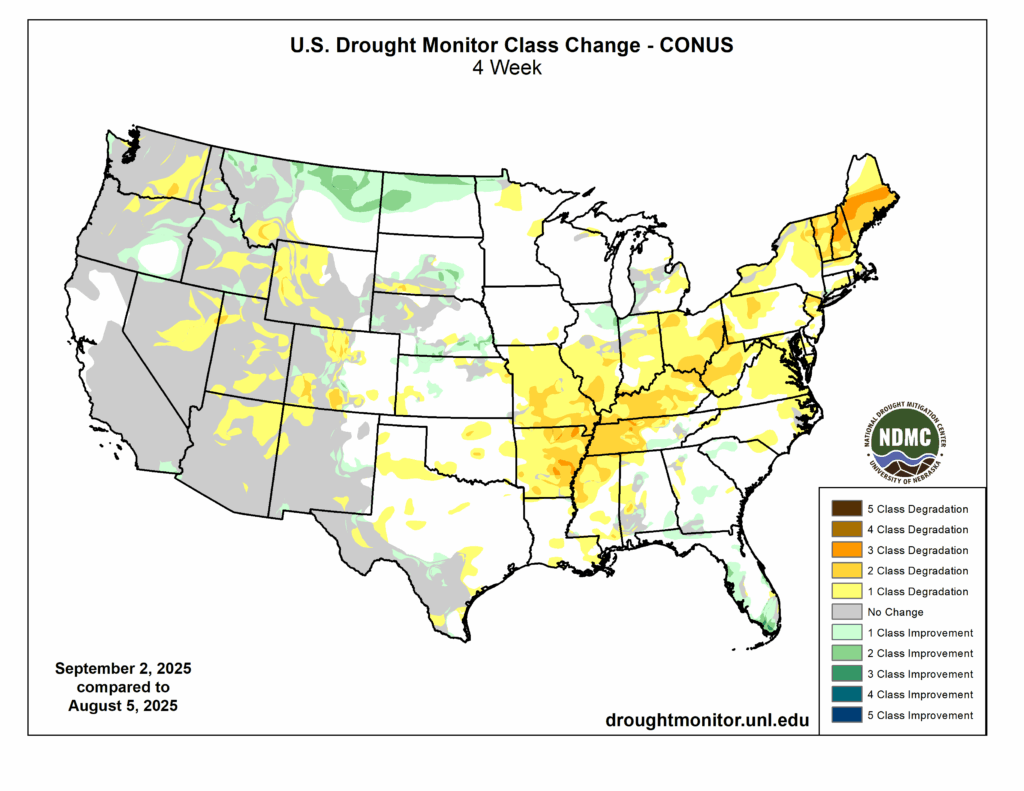
As of September 2, 2025, the U.S. Drought Monitor shows that drought conditions remain a major concern across much of the country, with particularly severe impacts continuing in the Southwest. Large portions of Arizona, Nevada, Utah, and New Mexico are in Severe to Extreme drought, with pockets reaching Exceptional drought levels. California is also experiencing widespread Moderate to Severe drought, especially inland, while parts of Idaho and Oregon are struggling with Extreme drought, threatening water supplies and ecosystems. In contrast, the Midwest and Plains display a mixed picture, with broad areas classified as Abnormally Dry to Moderate drought, though some localized improvements have been noted. The Northeast and Mid-Atlantic are showing signs of short-term drought stress, particularly in Maine, New York, and Pennsylvania, while the Southeast continues to deal with scattered Severe drought.
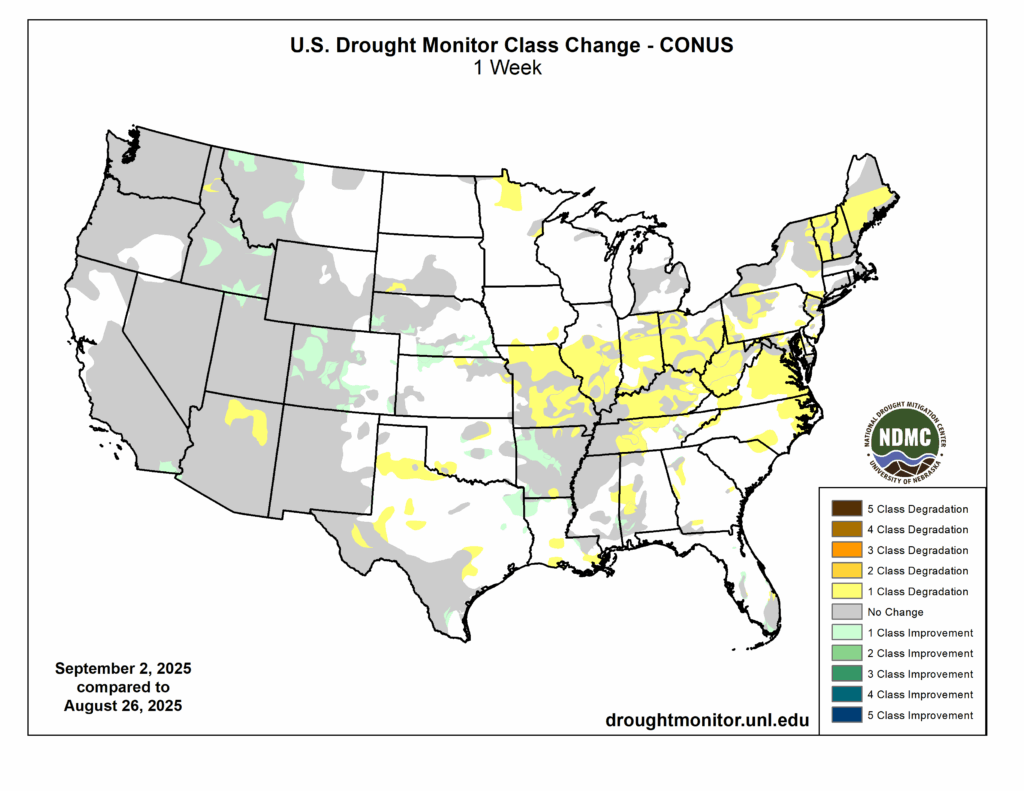
Comparing conditions to just one week earlier, from August 26 to September 2, several regions saw notable shifts. Parts of the Mid-Atlantic, Southeast, and Texas experienced one- to two-class degradations, signaling rapidly worsening drought stress. However, improvements occurred in the Northern Plains, Rockies, and sections of the Pacific Northwest, where recent rainfall has provided some relief. Overall, much of the country remained stable with little change, but the areas of worsening drought highlight how quickly conditions can deteriorate in the late summer season.
Looking back over the past four weeks, the broader trend underscores both the persistence and expansion of drought in many regions. While some improvement is evident in the central U.S. and the Northern Rockies, widespread degradation has occurred across the Northeast and Mid-Atlantic, where drought has intensified over the past month. The western U.S. continues to carry the deepest and most persistent drought, with long-term impacts to water availability, agriculture, and ecosystems. As we head further into September, close monitoring will be critical, as short-term weather shifts can either intensify drought conditions or provide much-needed relief.
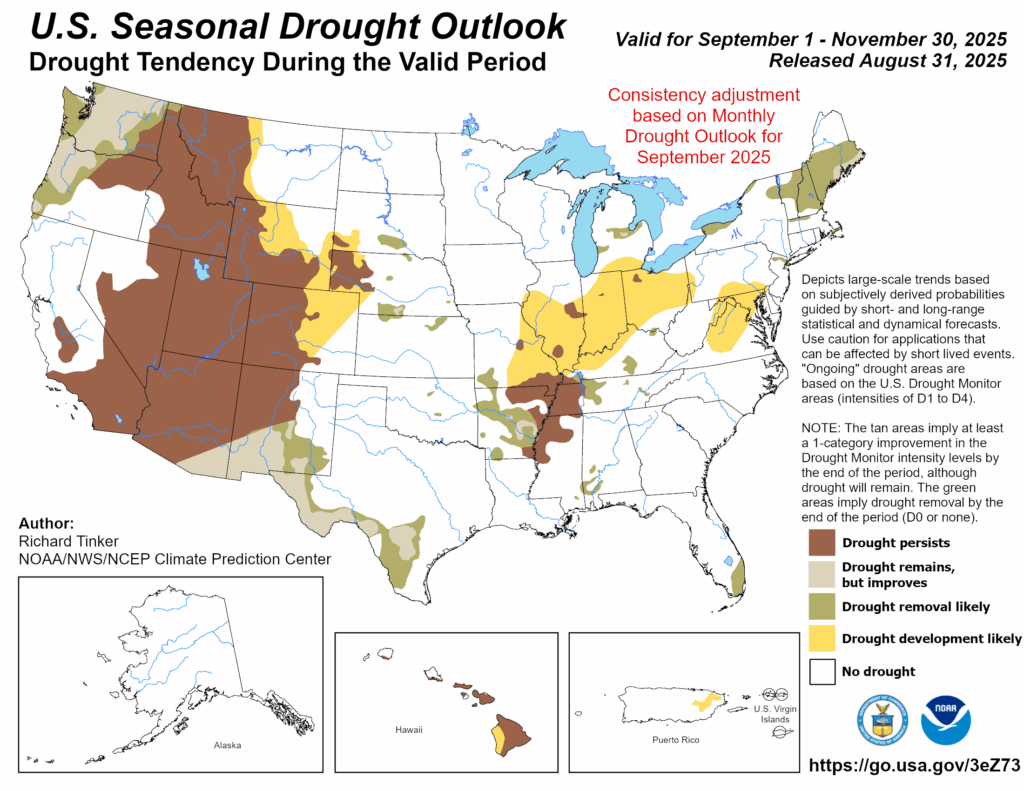
The seasonal drought outlook for September through November 2025 offers both challenges and cautious optimism. Across much of the Southwest and interior West, drought is expected to persist through the fall, with only limited improvement likely. In contrast, parts of the central U.S., including portions of the Southern Plains and Mississippi Valley, show potential for at least some improvement in drought intensity, though not full recovery. Encouragingly, sections of the Midwest and parts of the Southeast are expected to see drought removal by the end of the season if forecast rainfall materializes. However, new areas of concern are emerging, with drought development likely across portions of the Ohio Valley and mid-Atlantic, suggesting that late summer dryness could evolve into longer-term issues. Overall, while the seasonal outlook points to gradual improvement in some regions, the entrenched drought in the West remains the most persistent and concerning feature of the national drought landscape.
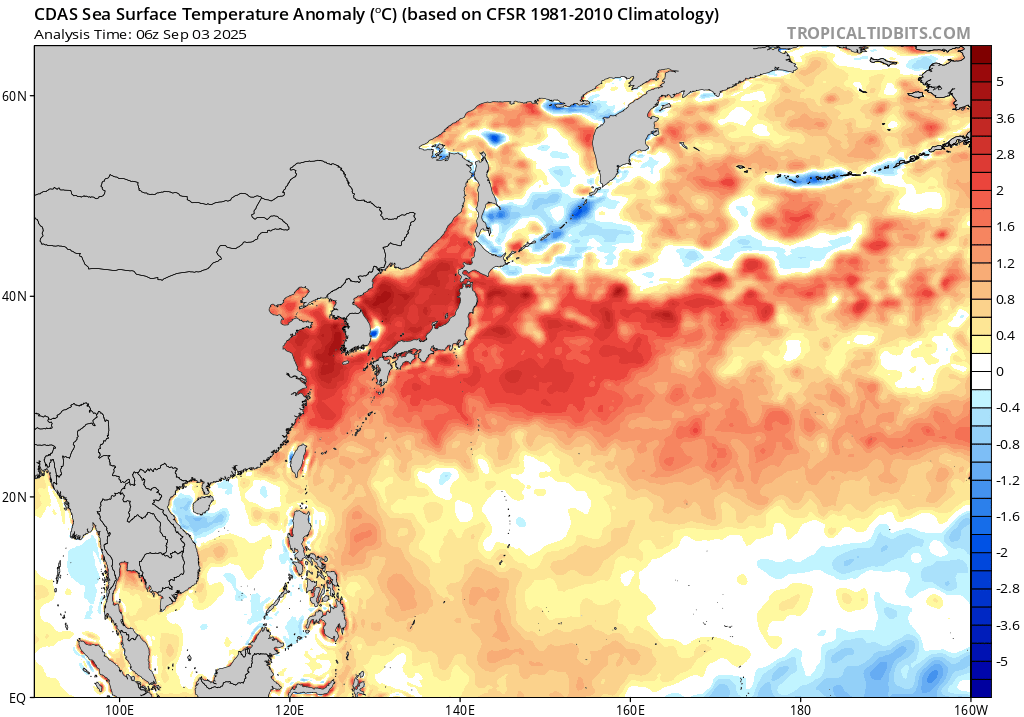
Asia had yet another hot summer, with population centers from eastern China to Korea to Japan all recording very impressive temperatures. This was driven by both the neutral to weak La Nina ENSO conditions as well as the anomalously warm SSTs adjacent to eastern Asia. We can see the impressive SST anomalies below, with most areas 2-3°C above the 1981-2010 normals.
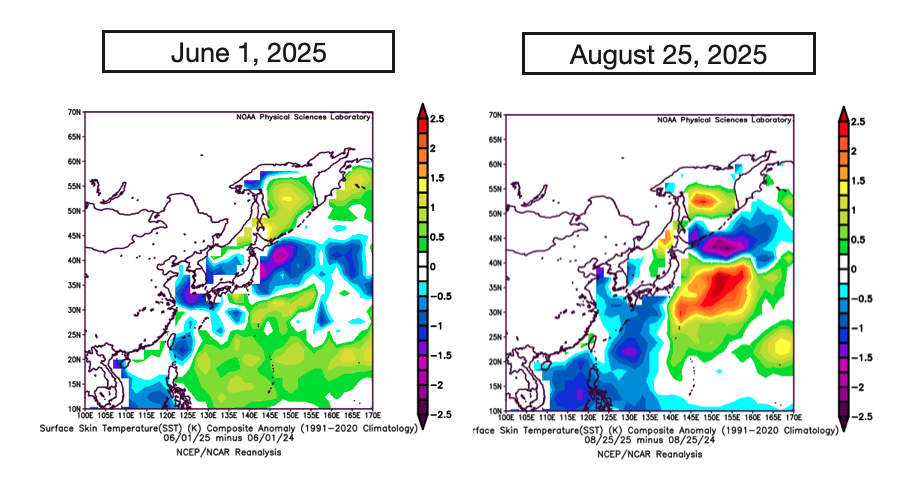
Comparing SSTs from 2025 to 2024, we can see early in the season (left) much of the water southeast of Japan was warmer than 2024 (warmer colors) while the Yellow Sea was cooler than 2024 (cooler colors). This largely continued through the season, with waters near Tokyo significantly warmer in 2025 versus 2024.
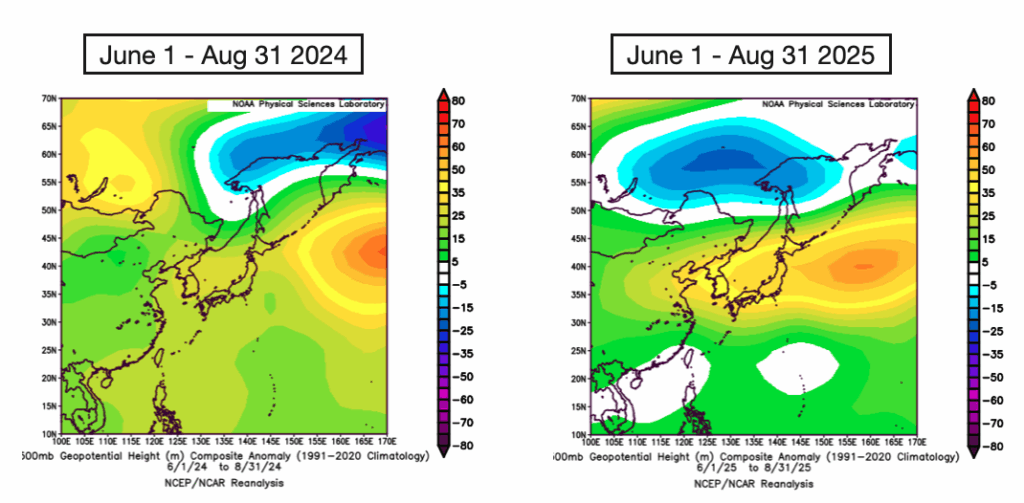
Looking at the upper level pattern, we can see the ridge (warmer colors) was actually stronger in 2025 over Japan and Korea compared to 2024. Both years had a bunch of ridging which supported all the warmth we witnessed.
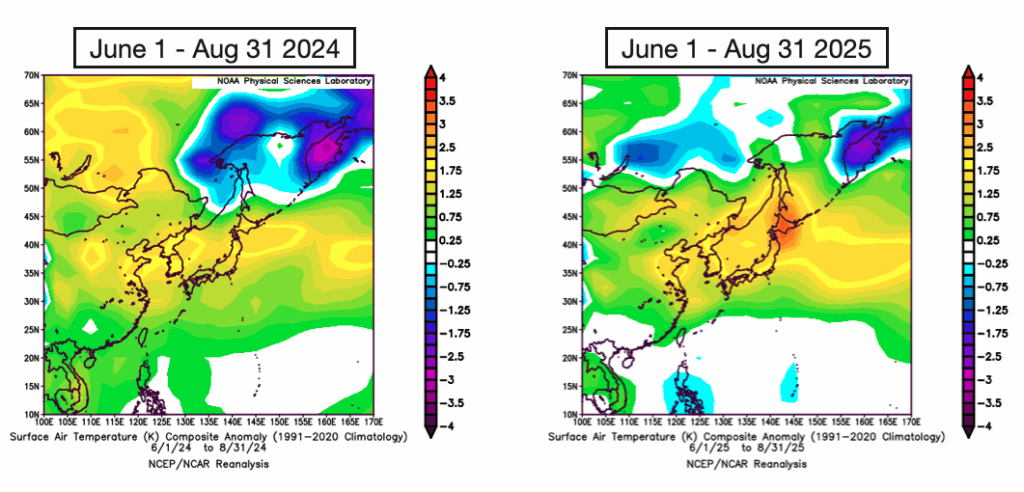
Looking at actually temperature anomaly, we can see northern Japan especially was warmer in 2025 versus 2024. The 2 seasons are side by side below.
Digging deeper, we plotted population weighted minimum and maximum temperatures for Tokyo and Kansai regions for the past 2 June 1-August 31 periods (2024 and 2025). Notice the overnight lows especially (but even daytime highs) were hotter in 2025 especially from mid-June through mid-July. Daytime highs were a bit higher during that same period especially in Kansai. That was the difference in terms of what drove 2025 to be a bit hotter regionally, and we can mostly blame those very warm SSTs.
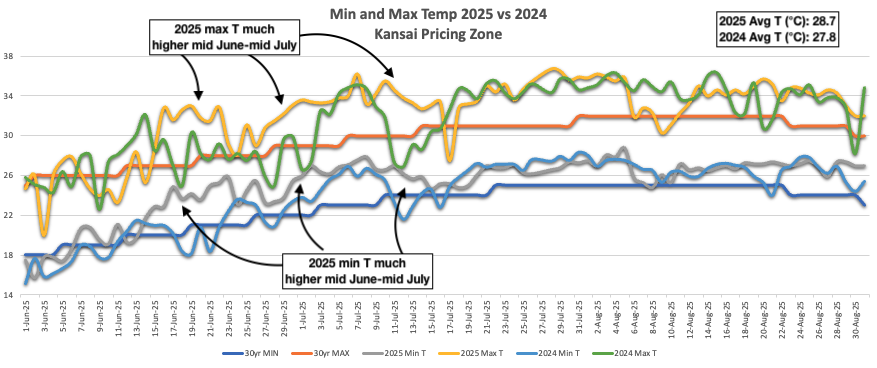
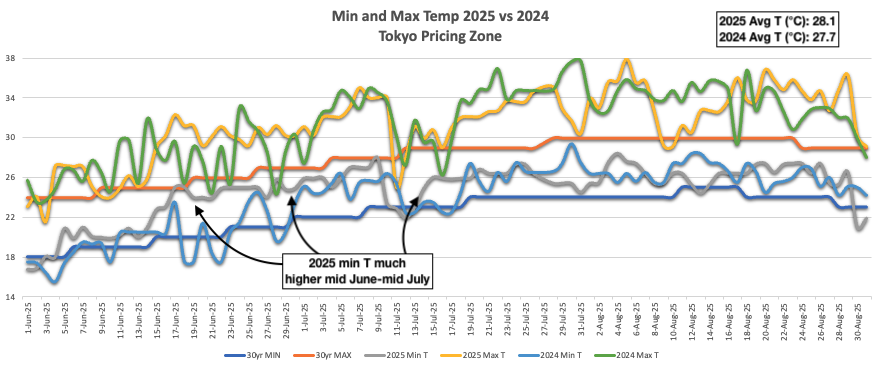
Bottom line: Tokyo was 0.4°C and Kansai was 0.9°C hotter in 2025 compared to what was observed in 2024 from June through August. This is because of ridging being a bit stronger, but more so due to SSTs being warmer, which allowed overnight low temperatures to be warmer than 2024.
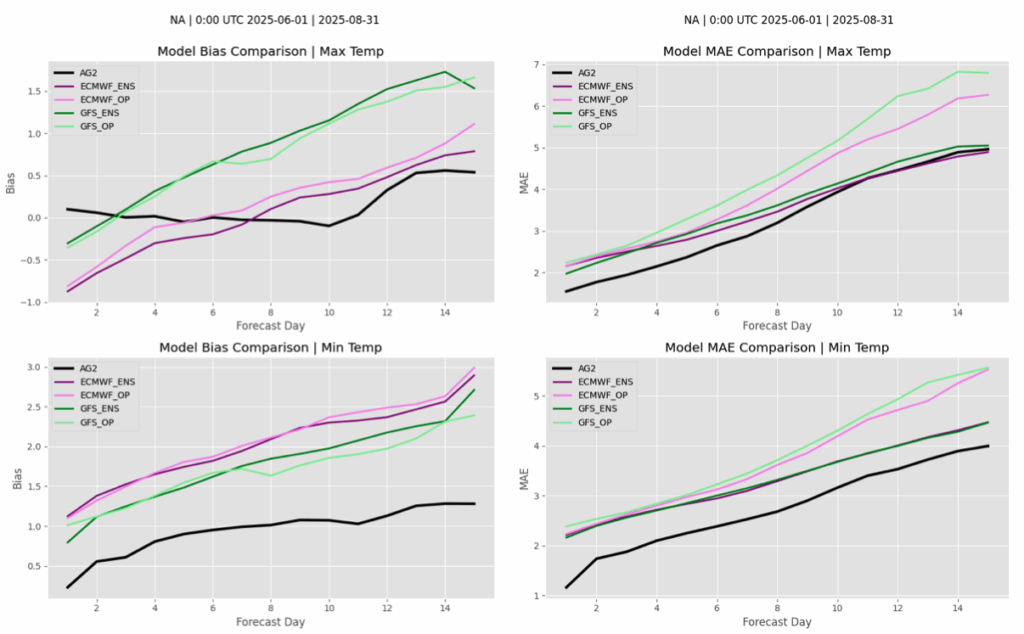
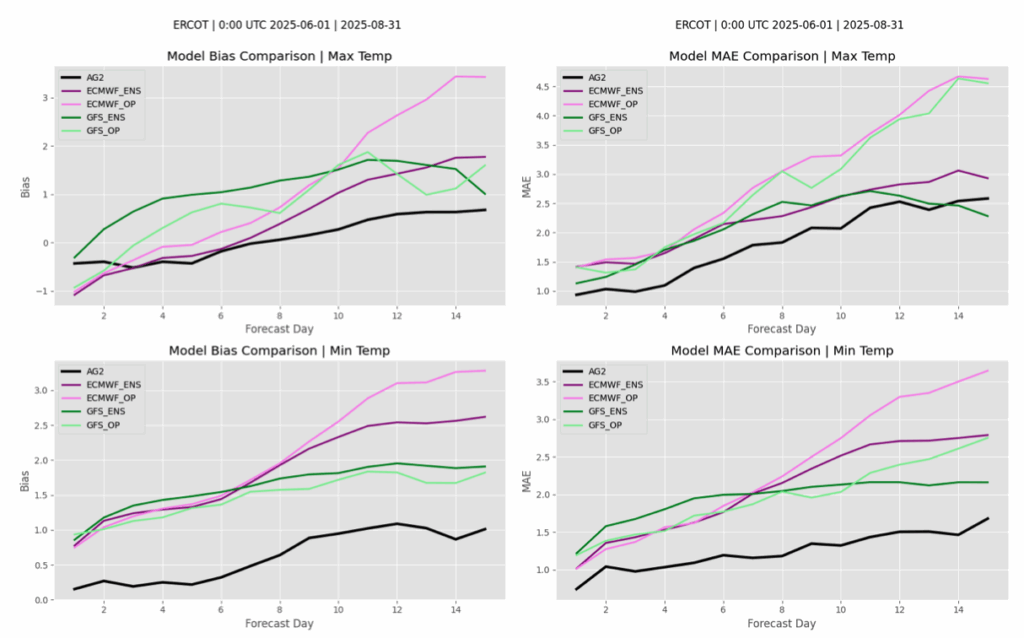
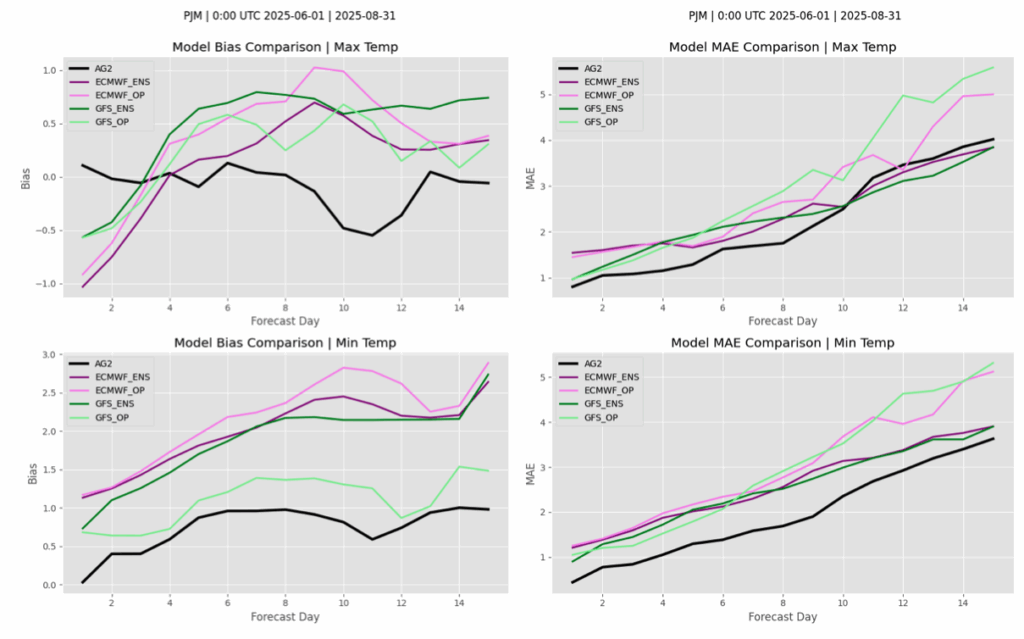
This quick hitter takes a look at AG2 temperature verification across North America and various ISOs this summer. Note the models on these charts are BIAS CORRECTED.
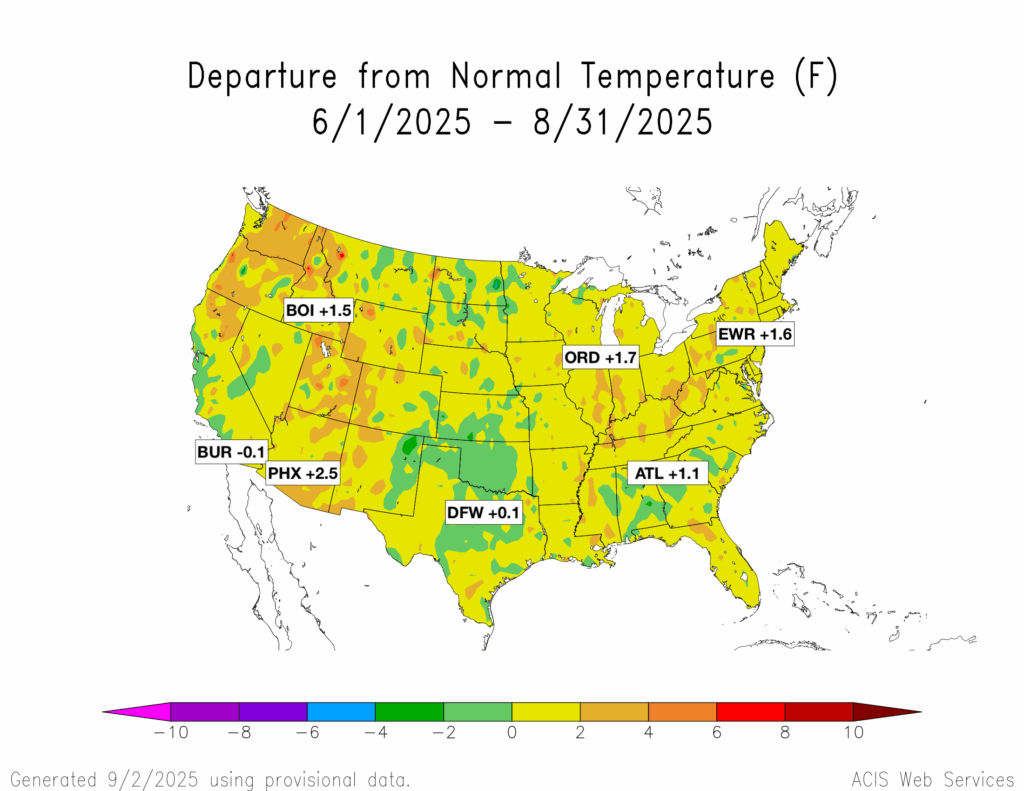
To start, let’s look at the temperature verification map for the CONUS from June 1 – August 31, 2025. Heat was spread out this year, with the Interior West and Northeast seeing extended periods, at times. All cities listed are cooler in 2025 compared to 2024’s June-August with the exception of Chicago (+1.7°F this year, +1.3°F last year).
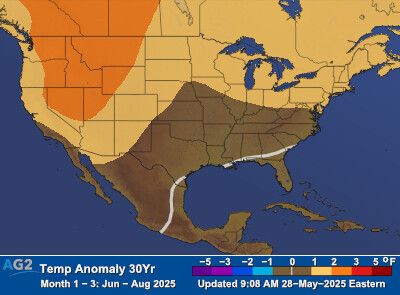
This was fairly close to AG2’s seasonal expectations – our map from the end of May for June-August is below.
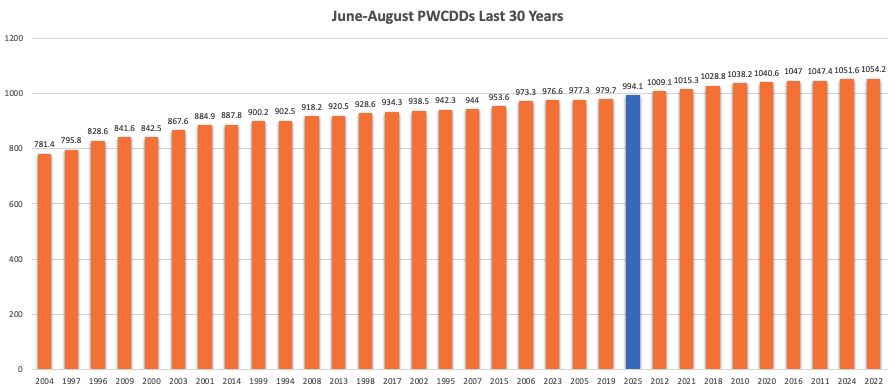
We ended the season with 994.1 CDDs, the coolest since 2023 (976.6) and second coolest since 2019 (979.7).
Starting nationally, AG2 MAE (black) was superior throughout in terms of max and min temperatures. The GFS ENS was generally the best performing inside 2 days versus other guidance. The ECMWF ENS was also quite good.
In ERCOT, AG2 was superior for much of the period for max temps, with the GFS ENS better day 15-16. The AG2 forecast was best for min temps throughout. Models were much too warm for min temps.
In PJM, AG2 MAE is generally the lowest/best throughout the 15 day period for both min and max temp, but did get challenged in the 11-15 day by the bias corrected GFS/ECMWF ENS for max temps.
Finally, in CAISO, AG2 was best throughout the 15 day period. The bias corrected ECM ENS was superior late in the period for max temps, day 14-15.
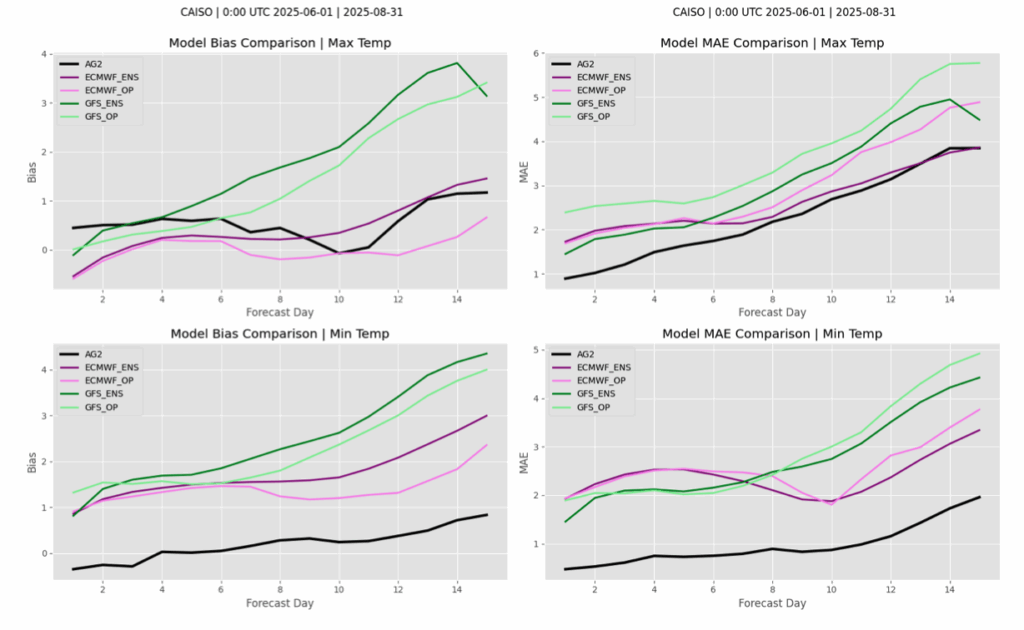
Bottom line: generally AG2 out performed all bias corrected modeling throughout the 15 day period. June-August ended with 994 CDDs. Models tended to struggle most with min temps, leaning too warm in many areas.