Taken together — strengthening El Niño conditions and more widespread pre-existing drought — the background state leans toward a hotter and drier-than-normal summer risk profile for ERCOT. While Baja California SST anomalies may offer some insight into Pacific variability, they are unlikely to be the decisive factor. The broader ENSO evolution and soil moisture feedbacks are much more consequential influences for summer 2026 load risk.
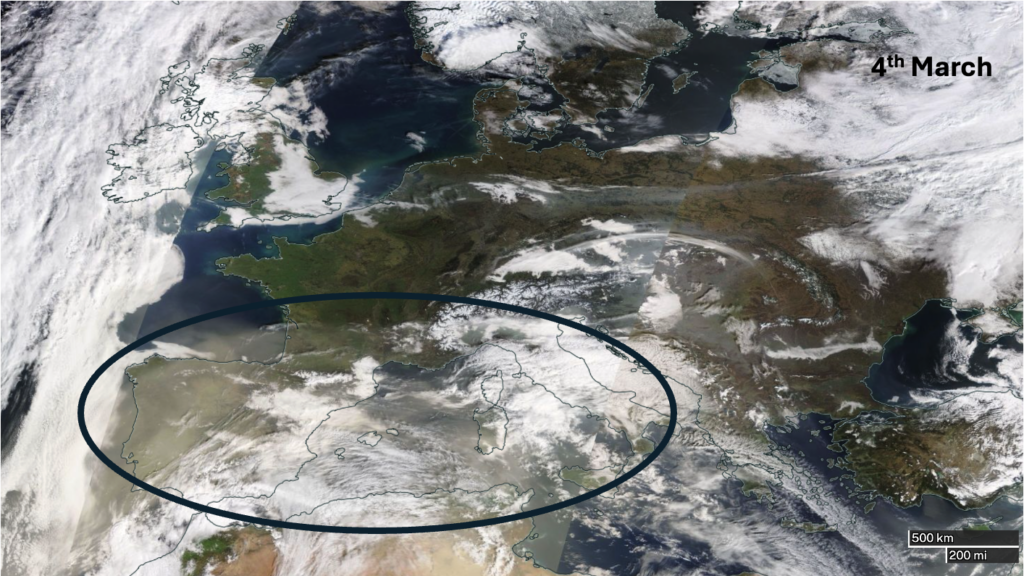
The satellite image from yesterday below, clearly shows the hazier skies across Iberia, the Mediterranean to Italy associated with the current Saharan dust outbreak:
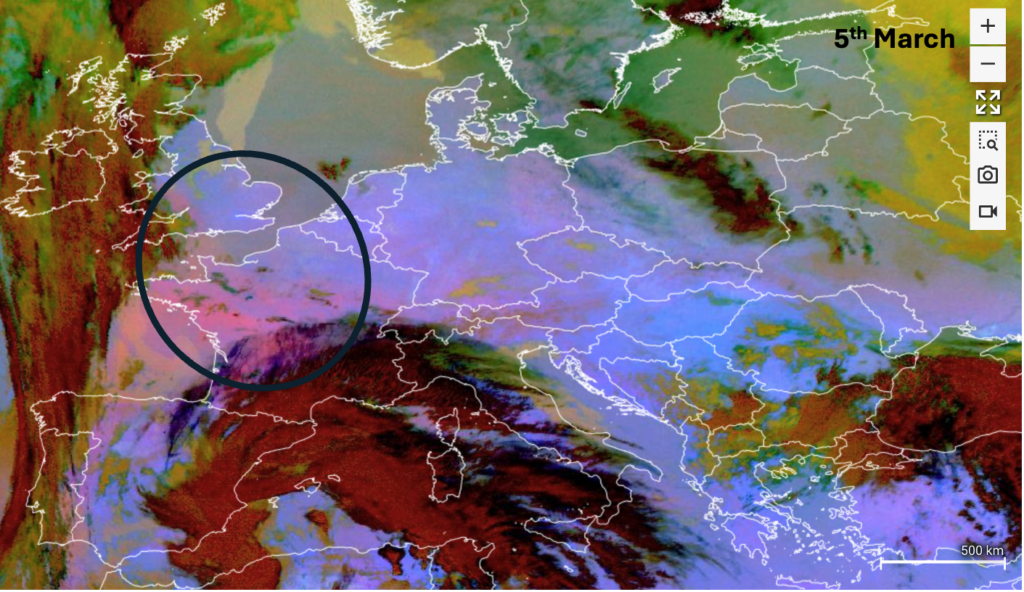
While the images below show the dustier skies now spreading across France towards the British Isles. Dust in the bottom image is shown by the pink shading.

The latest dust load forecast from the University of Athens below shows the highest dust load currently across parts of Iberia, France to southern areas of the British Isles today, before then spreading to Benelux and Germany tomorrow. Through front weekend, dust levels are forecast to remain elevated across northern Europe.
The Barcelona Dust Regional Centre forecast to aerosol optical depth (AOD) below shows a similar pattern of higher levels spreading across northern Europe over the next few days.
So why Saharan dust important?
Saharan dust can have an impact on solar power generation both directly and indirectly. Directly, dust in the atmosphere blocks and scatters solar radiation from the sun, hence less incoming radiation hitting solar panels, thereby reducing generation. Dry deposition of the dust directly settling and building up on the panels will also reduce the power generation. Wet deposition, the process of removal of dust from the atmosphere by precipitation can also lead to dust build up on panels and reduced generation. Finally indirectly, Saharan dust in the atmosphere can act as cloud condensation nuclei (CCN), which is needed for clouds to form. Therefore dust in the atmosphere acting as CCN can lead to an increase in cloudiness, thereby reducing incoming solar radiation leading to a reduction in solar generation.
Risks are therefore to the downside for solar across Iberia, France and the British Isles today, with the main downside risks on Friday being across the British Isles to Benelux and Germany. Then through front weekend, slight downside risks across northern Europe.
This is a follow-up blog to an earlier article available at https://www.ag2trader.com/1-15days/?blogPostID=190084, taking it to the main large-scale driver for Europe in the sub-seasonal space this time of the year (MJO and Stratosphere). The MJO could be speeding up and, reinforced by a Kelvin Wave, could start stimulating a pattern transition into the back half of March towards lower NAO values, while the unfolding SSW in the background struggles to show clear footprints.
Tropical convection is forecast to emerge in the Atlantic basin into mid-March, and it has been monitored for a while for its potential to be a cold trigger for Europe. The latest projections suggest that such convections could be supported by active phases of both the MJO and a Kelvin Wave. If those two oscillation synchronize could provide a larger magnitude forcing as a consequence on to the NAO index.
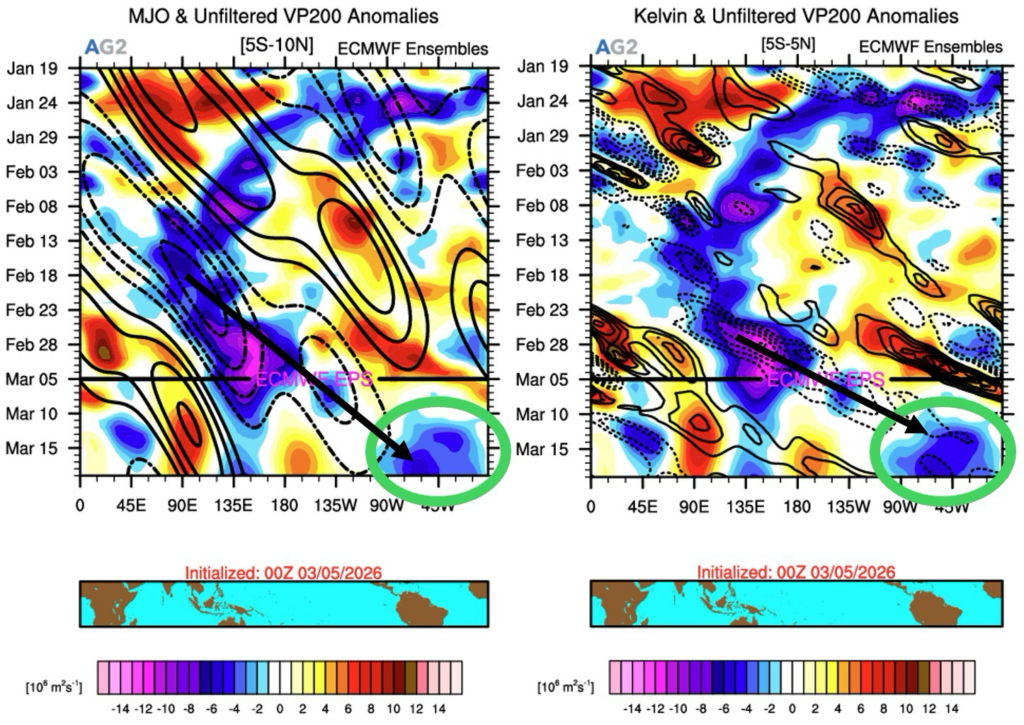
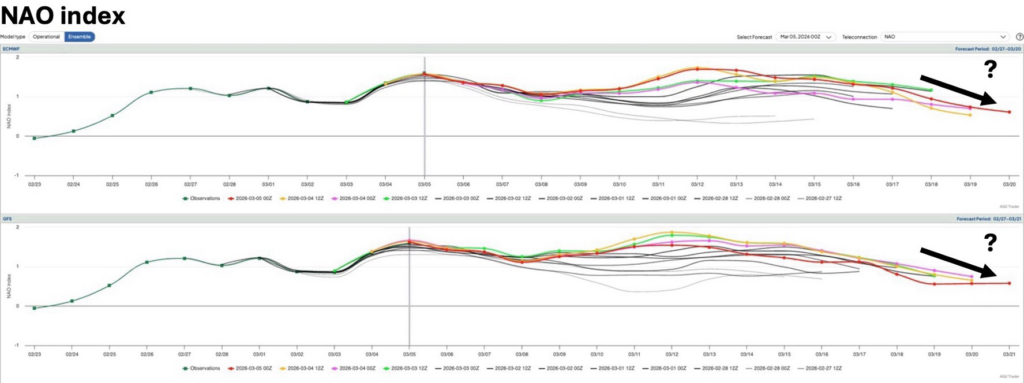
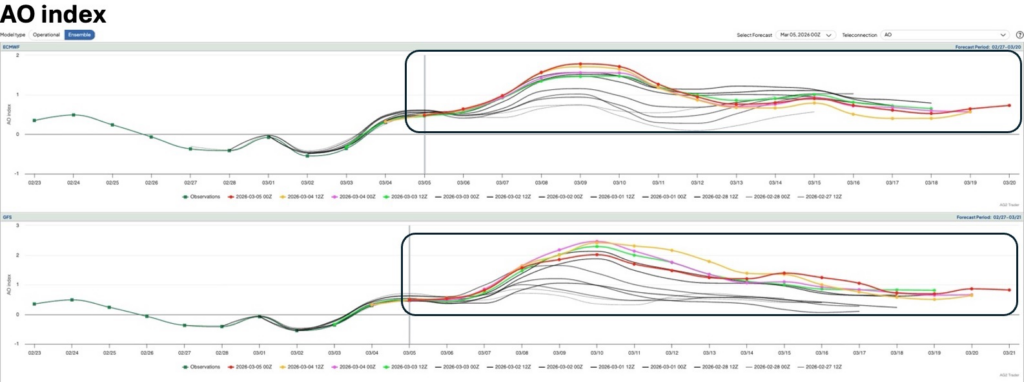
At the minute, as discussed in our previous blog, less +ve NAO conditions are forecast into W12. Based on the plots below, the risks is to see an increased downward forcing on that index W12+.
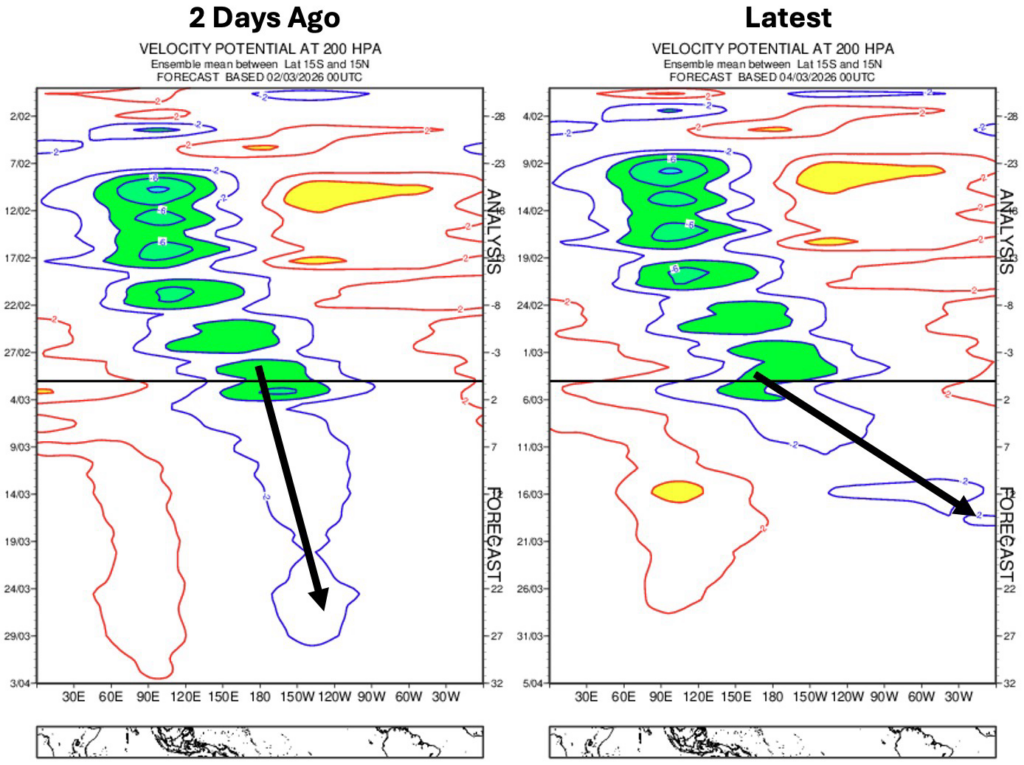
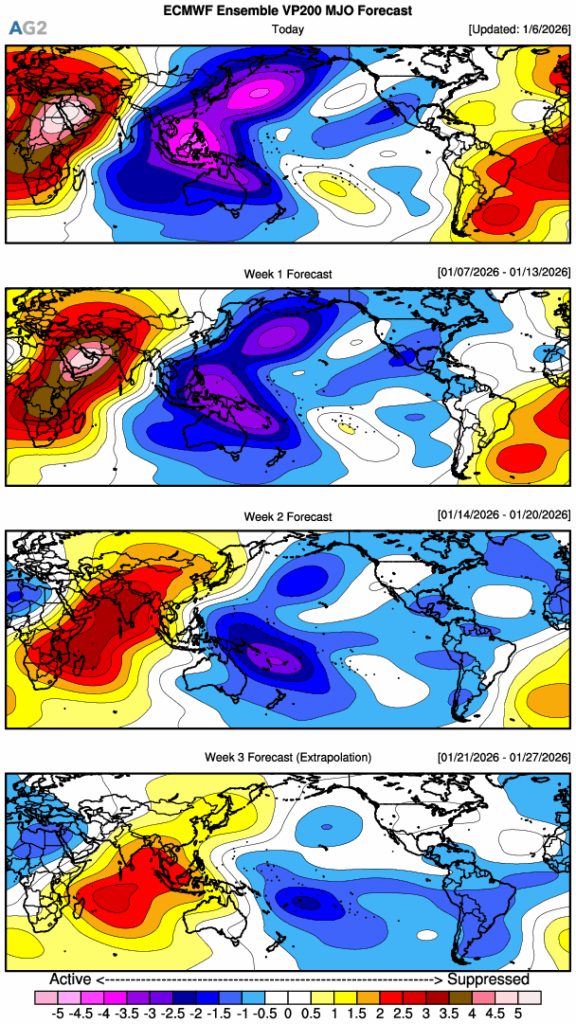
Compared to a couple of days back, the latest filtered velocity potential forecasts from ECMWF, show a quicker E’ward progression of tropical convection (some combination of MJO and Kelvin Wave) towards the Americas and the Atlantic. Quicker arrival of more organized convection into the Atlantic equals earlier and perhaps higher risks of seeing a colder or at least less mild shift in Europe.
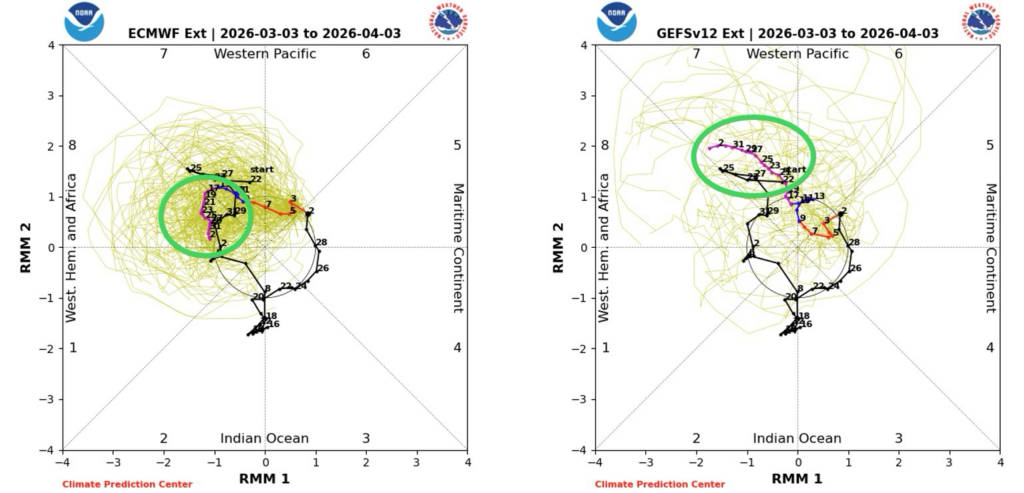
The wheeler diagrams presented below shows that while EC now brings the MJO into phase 8 (increased colder risks for Europe) later in March, GFS lingers behind over the Pacific. Quite some spread there…
And obviously his highness, the Polar Vortex. A split-vortex type major SSW is unfolding.
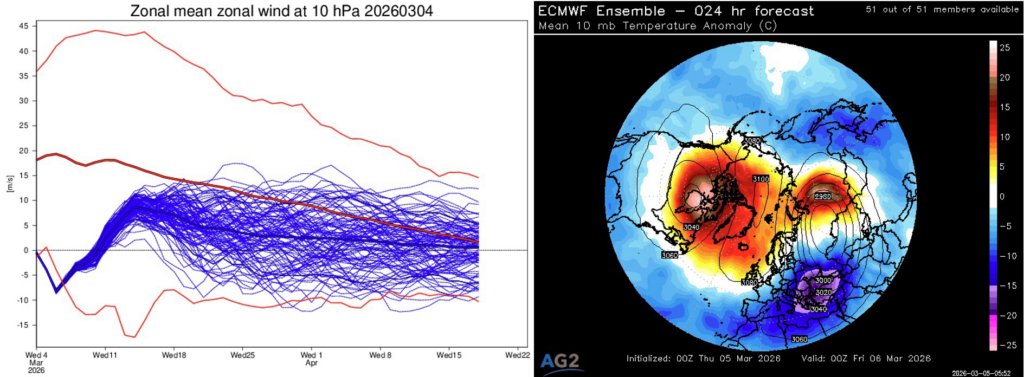
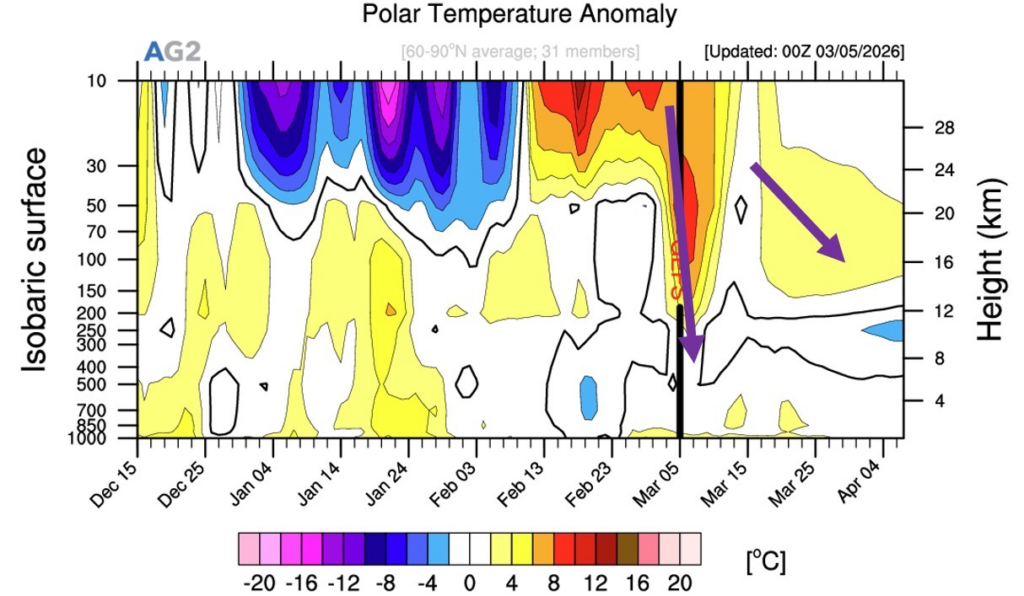
Anomalous warmth is forecast to rapidly propagate downward through the stratosphere, but coupling with the troposphere doesn’t look too impressive at the minute. We should not ignore longer wave downwelling either, which could extend the risks of seeing stratospheric forcing later in the month if not even further.
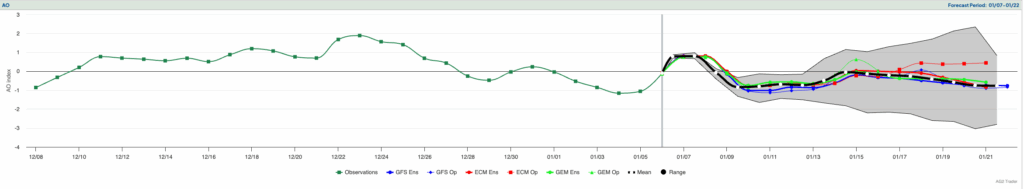
The AO forecast is the main detractor of a stronger stratosphere-troposphere coupling event. Tighter coupling would in fact skew the AO towards negative values, while the latest projections resolve an overall +AO through the next couple of weeks, limiting the Arctic’s propensity to open its cold-air taps for now.
Bottom Line: The latest EC projections show a quicker E’ward propagation of the MJO towards the Atlantic by mid-month. If this is confirmed and aligns with a Kelvin Wave also reaching the Atlantic in a similar timeframe, we could see colder/less mild risks increase for Europe W12+, along with a descent of the NAO index. Meanwhile, an unfolding split-vortex type major SSW in the background also suggests colder risks through March if not beyond, while an AO seemingly locked in a +ve phase would limit the supply of colder air. We should however closely monitor any further MJO evolution now and as well as any potentially tighter coupling between stratosphere and troposphere for clearer signals towards stronger forcing to a pattern shift in Europe later in March.
Latest observations show that snowpack is below normal across most of Japan. Areas with above-normal snow are limited to parts of Hokkaido and northern Tohoku.
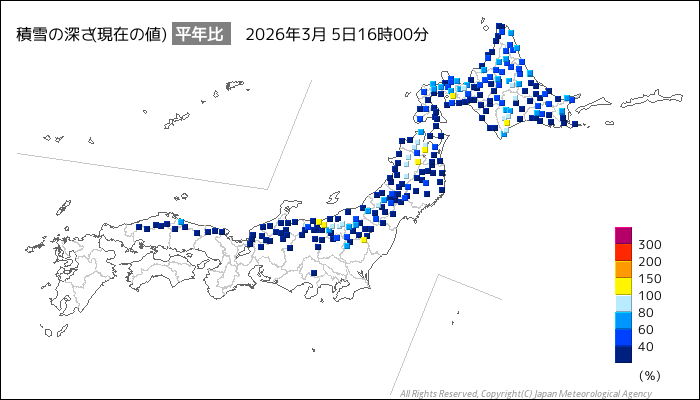
Reservoir storage is also low, with many dams sitting below 50% capacity, reflecting the dry winter conditions.
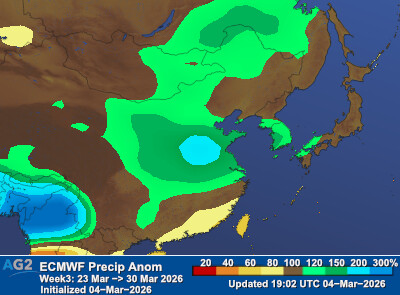
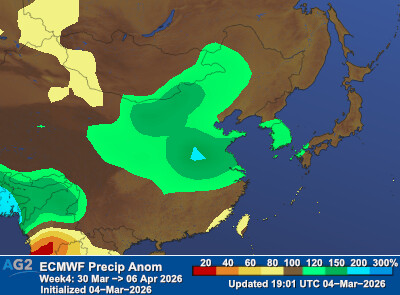
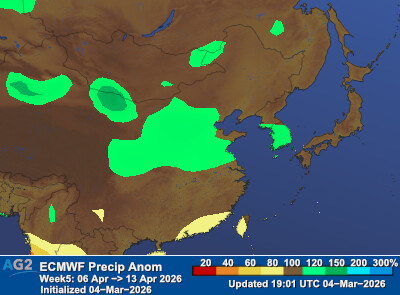
Precipitation over the next two weeks is very likely to remain below normal, and there is no strong signal for above-normal rainfall even out to around five weeks.
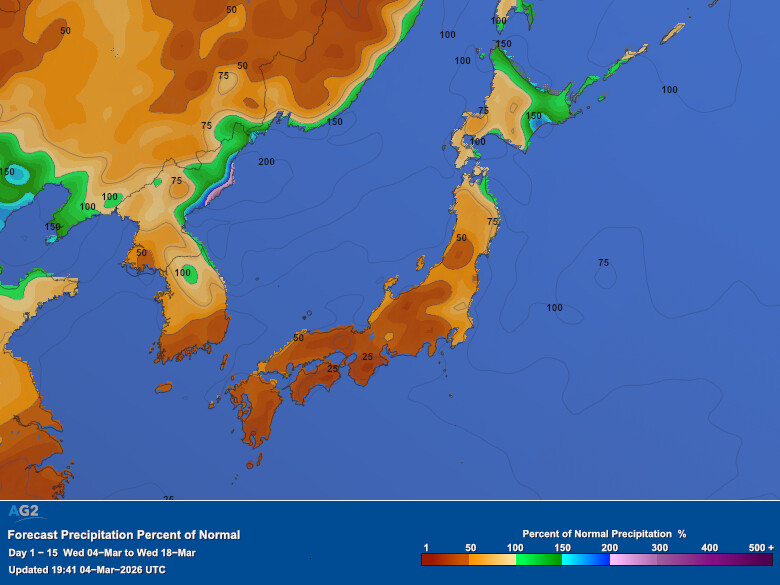
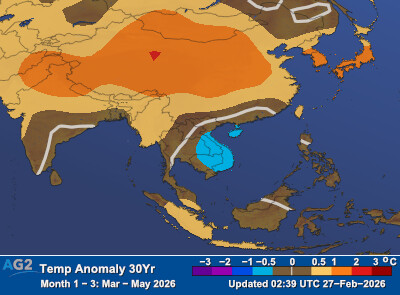
At the same time, the 3-month temperature outlook is near to above normal, suggesting earlier-than-usual snowmelt in mountain areas.
This creates a mixed hydro picture: earlier snowmelt could temporarily support hydro generation in March–April, but if rainfall remains limited into May and beyond, inflows may weaken and hydro availability could decline later in spring.
Summary
East Asia saw a broadly warm month, driven by a relatively mild upper-level pattern despite occasional cold intrusions. Over Japan, low- and high-pressure systems moved through in a fast cycle, and winter monsoon conditions did not persist for long. Early in the month, a brief but strong winter pattern pushed cold air south, producing heavy snowfall across the Sea of Japan side and, locally, the Pacific side. Mid-to-late month was generally dry as storm tracks were limited, before more organized rain arrived later, especially across northern/eastern Pacific-side Japan and western Japan. Temperatures were notably above normal across northern/eastern Japan and eastern/southern China. Solar conditions were generally favorable outside northern China.
Synoptic pattern
Low- and high-pressure systems moved through from China toward Japan in a recurring cycle. In Japan, winter-monsoon (“winter-type”) patterns did not persist for long, and there were periods dominated by mobile high pressure. Early in the month, a brief but strong winter pattern pushed cold air south, bringing heavy snow mainly to the Sea of Japan side of eastern and western Japan, with localized heavy snow also on the Pacific side.
Through the first part of the late month, storm and frontal impacts were limited and precipitation stayed generally low. From mid-to-late month, lows and fronts became more active again, bringing more organized rainfall, especially across northern/eastern Pacific-side Japan and western Japan.
Upper-level pattern (500mb GPH) and temperature anomalies
The polar-front jet occasionally dipped south near northern Japan, allowing some cold intrusions. However, 500mb height anomalies were often positive near Japan, limiting sustained upper-level cold influence. At the surface, both the Aleutian Low and the Siberian High were relatively weak.
Temperature
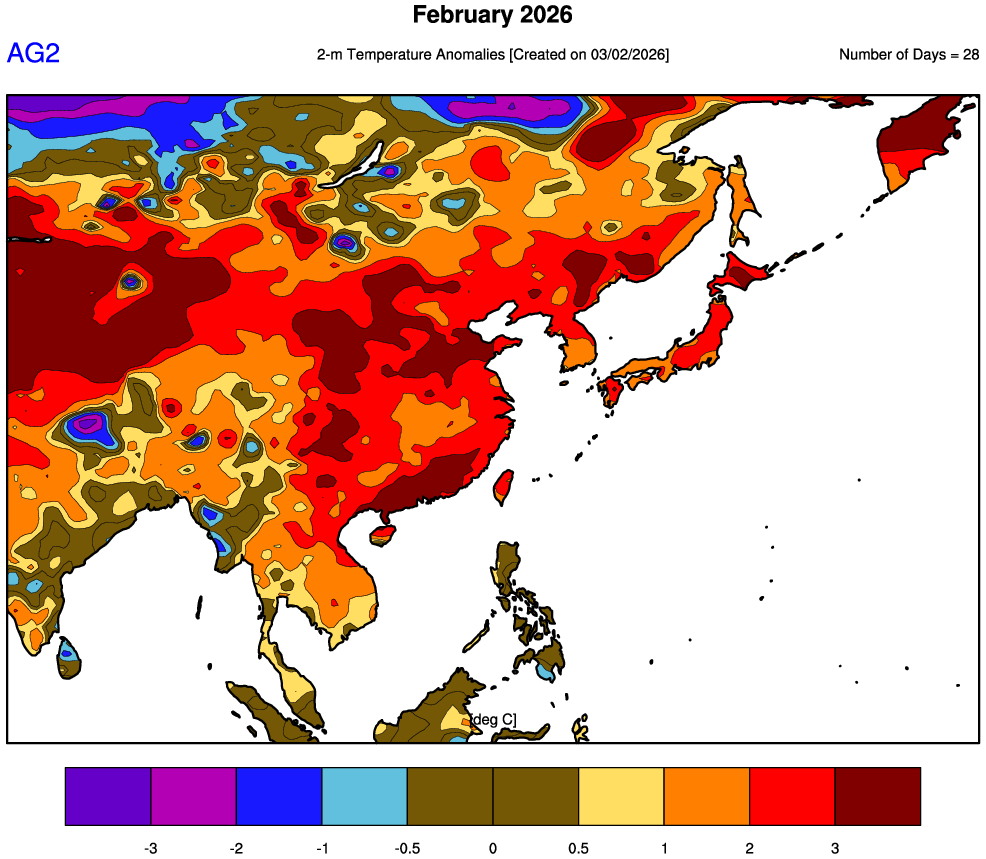
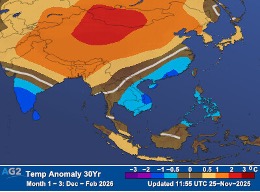
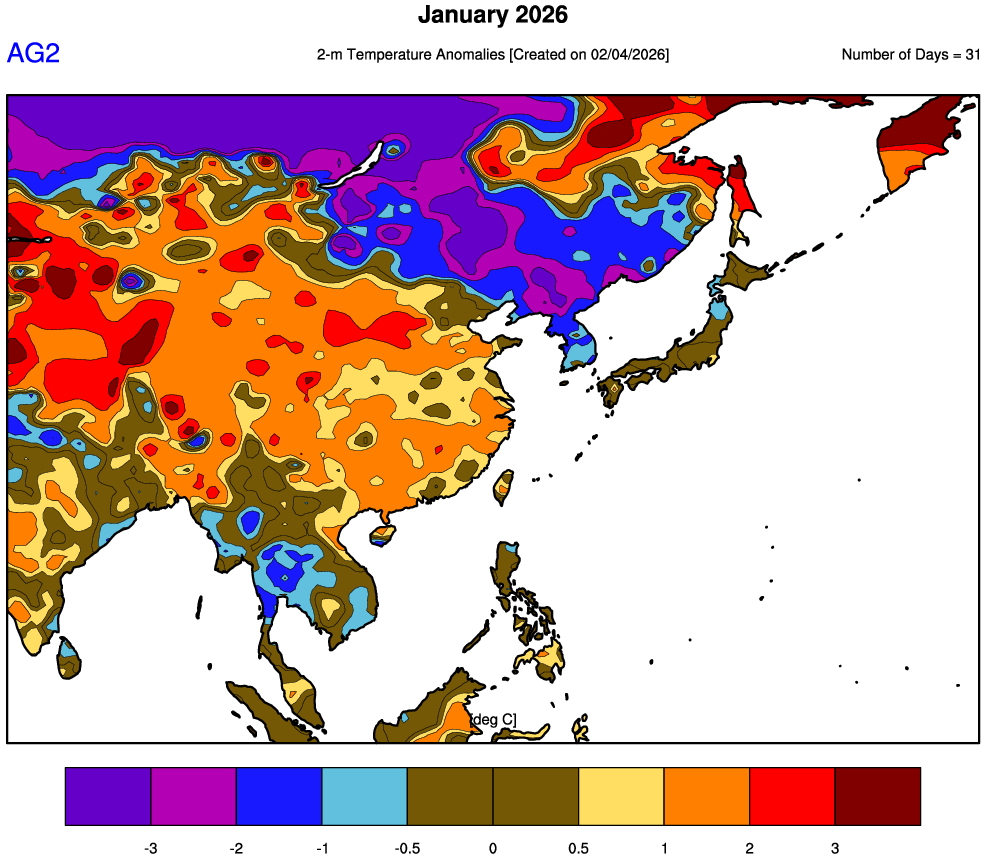
Temperatures were above normal across much of East Asia, with the strongest warm anomalies over northern/eastern Japan and eastern to southern China.
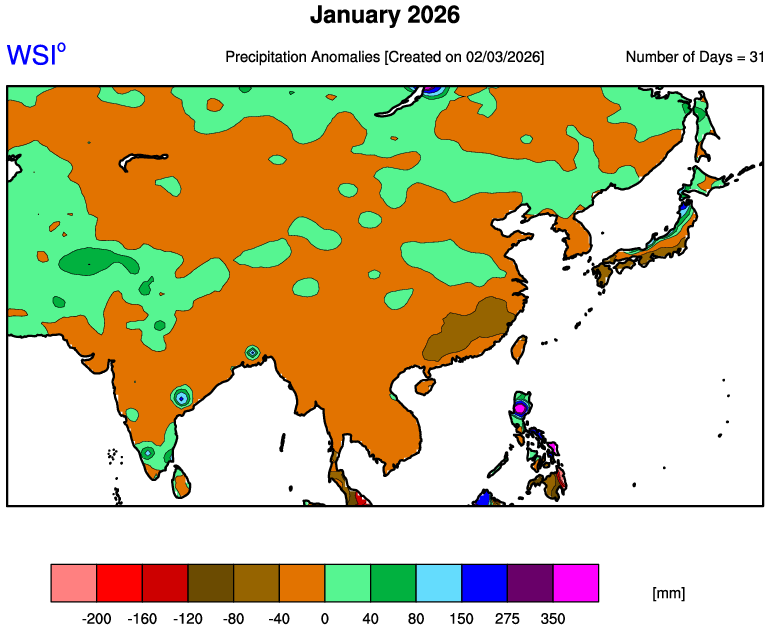
Precipitation
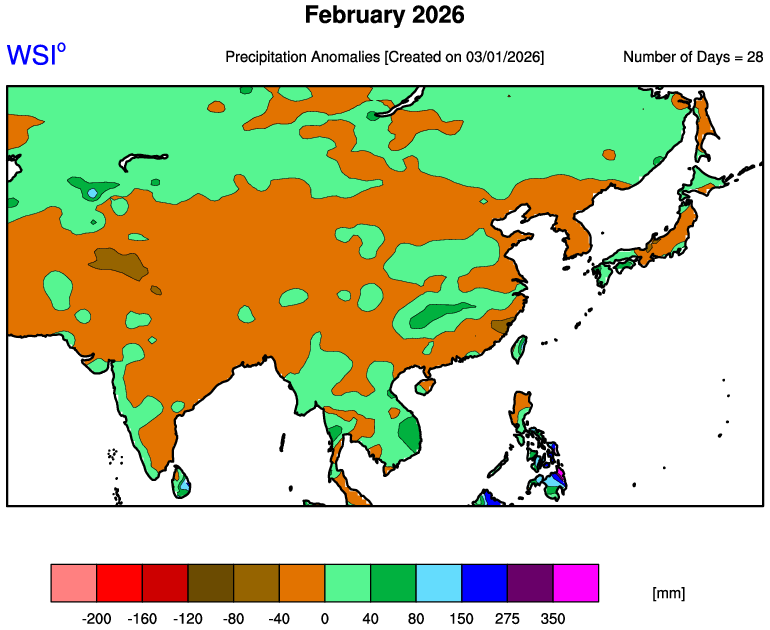
Precipitation was above normal in northern Japan, western Japan, Northeast China, and parts of eastern China, while eastern Japan, South Korea, and southern China were drier than normal.
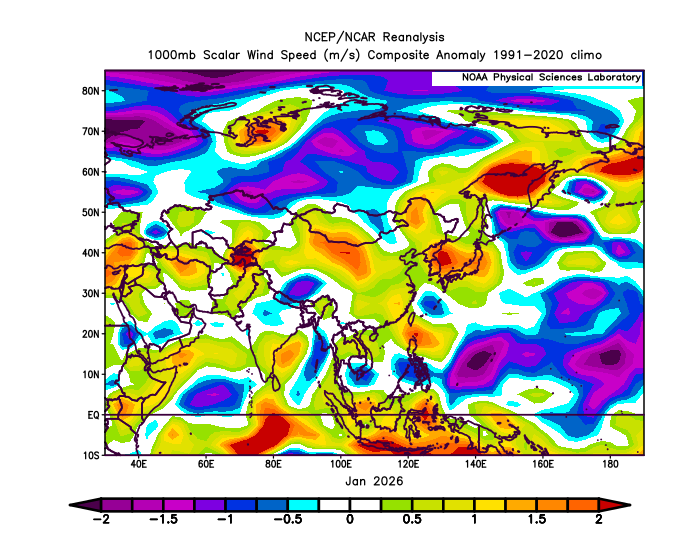
Wind
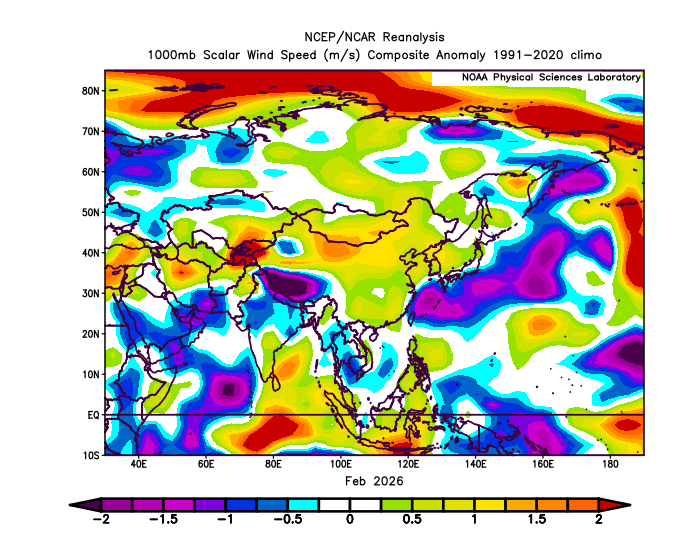
Winds were stronger than normal in China, South Korea, and parts of northern Japan, while the Pacific side of Japan and the Okinawa region were relatively lighter.
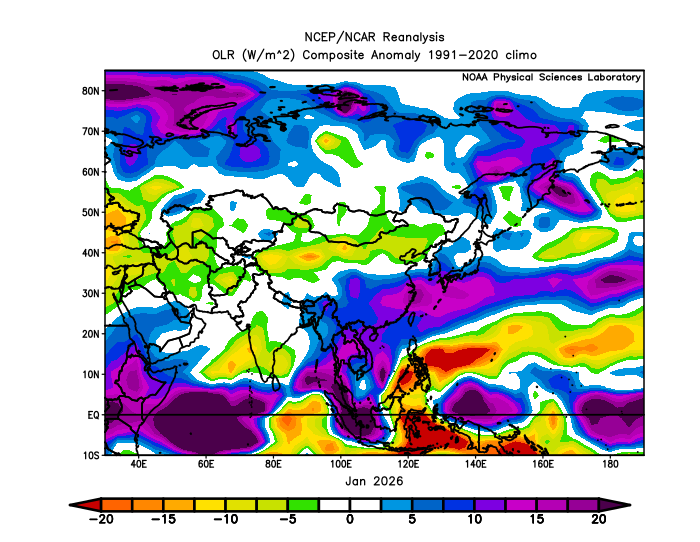
Solar radiation / cloud cover
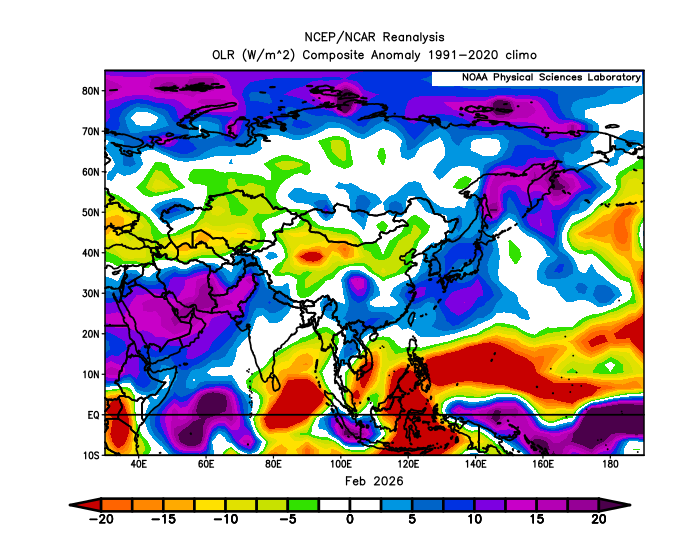
Solar conditions were favorable across Japan, South Korea, and eastern/southern China, while northern China saw slightly weaker solar due to cloudier conditions.
Archives
- January, 2026: https://www.ag2trader.com/1-15days/?blogPostID=189802
- December, 2025: https://www.ag2trader.com/1-15days/?blogPostID=189480
Temperature
This winter was warmer than normal across much of East Asia, except parts of northern China.

Comparing AG2’s late-November outlook for Dec 2025–Feb 2026 with NOAA reanalysis, results were generally strong for Japan and South Korea. In northern China, the forecast was warmer than observed, while in southern China it was cooler than observed.
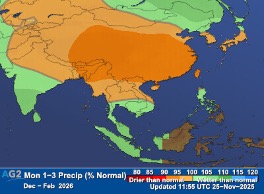
Precipitation
Precipitation was below normal across eastern/western Japan, South Korea, and southern China, while northern Japan and northern China were slightly wetter than normal.
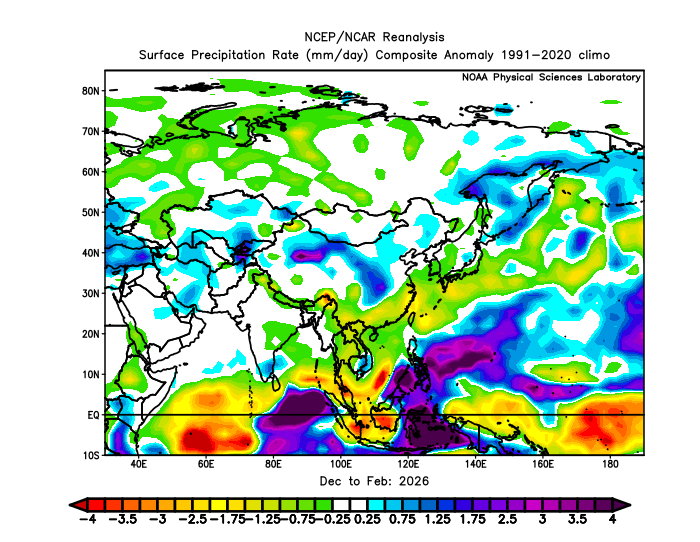
Against our late-November forecast, agreement was particularly good for Japan, South Korea, and southern China, suggesting the broad precipitation signal was captured well.
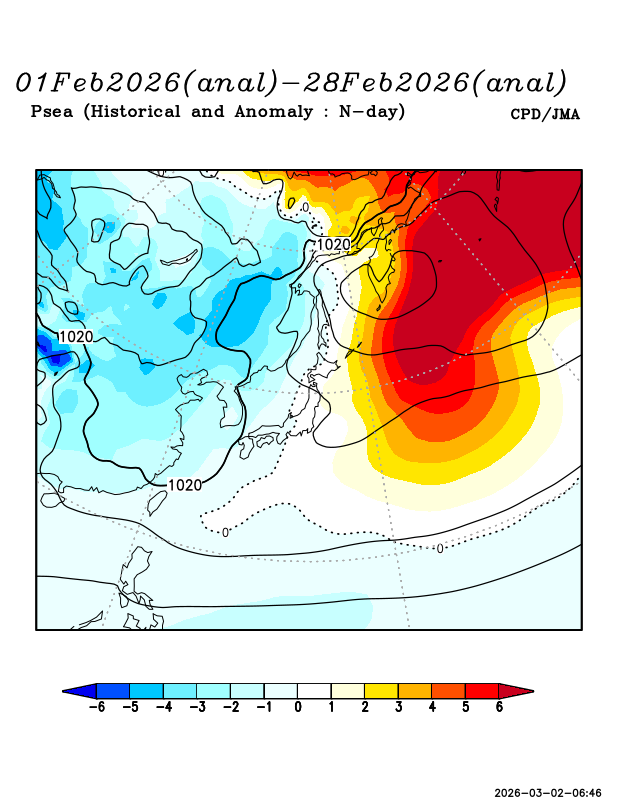
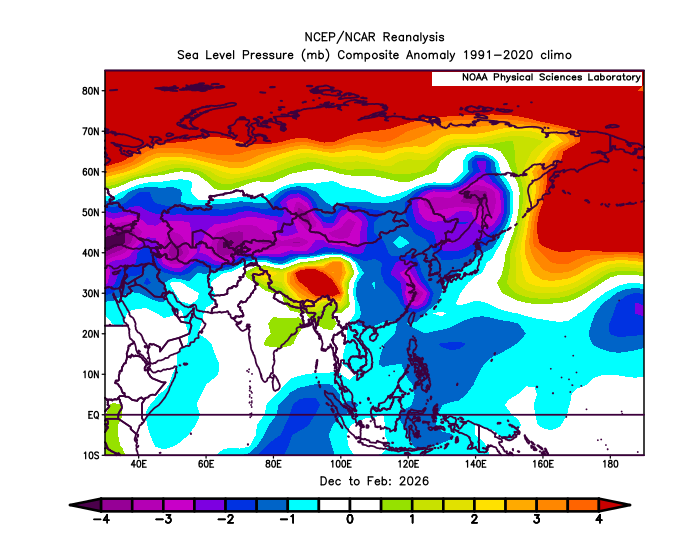
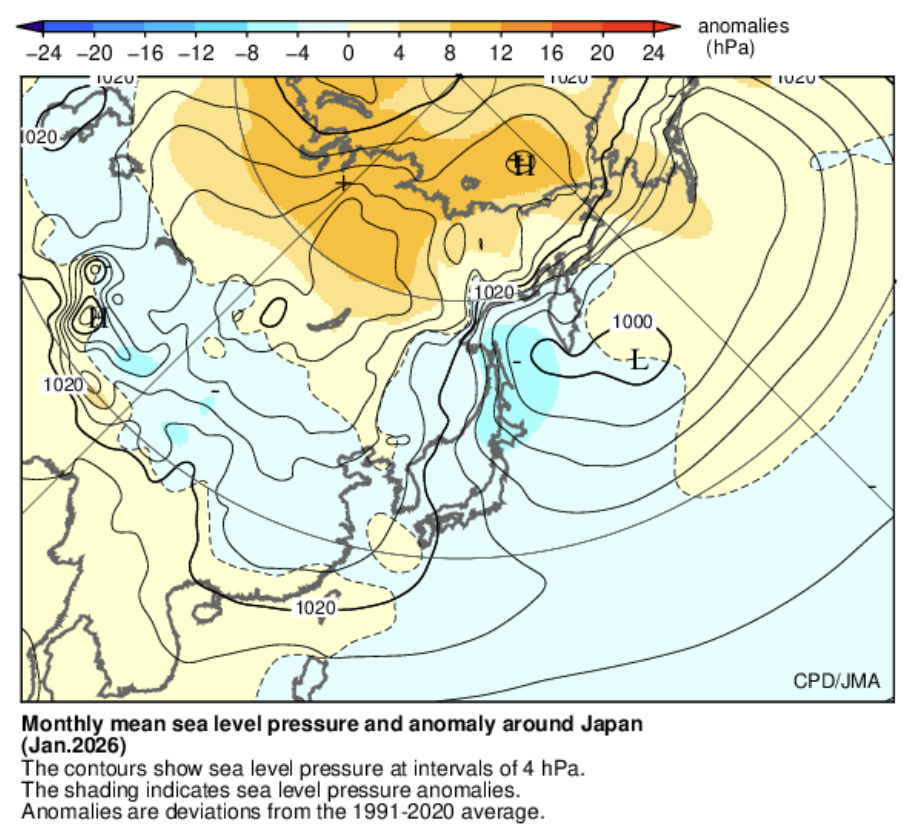
Sea-level pressure (SLP)
SLP was lower than normal across much of East Asia, while higher-than-normal pressure was present near the Aleutians. This setup made persistent “classic winter monsoon” patterns less likely. Cold-air outbreaks occurred mainly in January and early February, but they were generally short-lived.
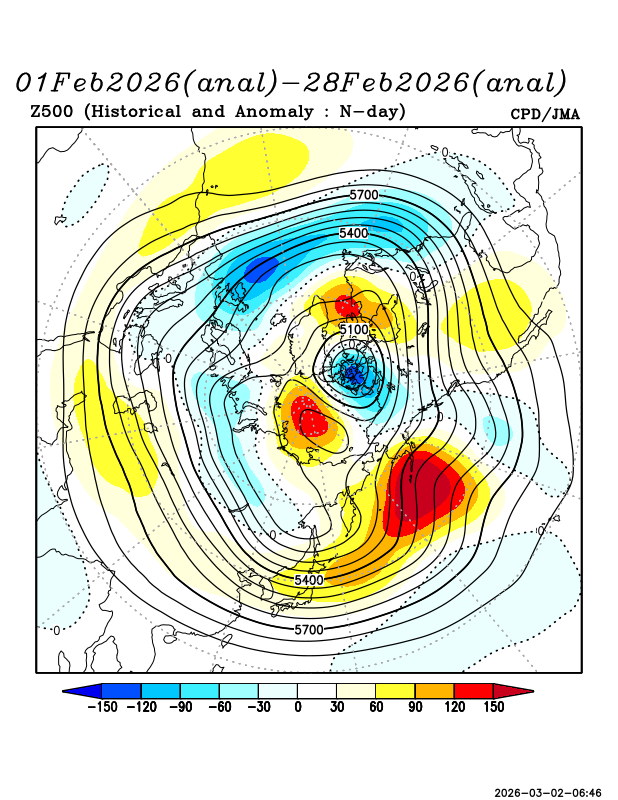
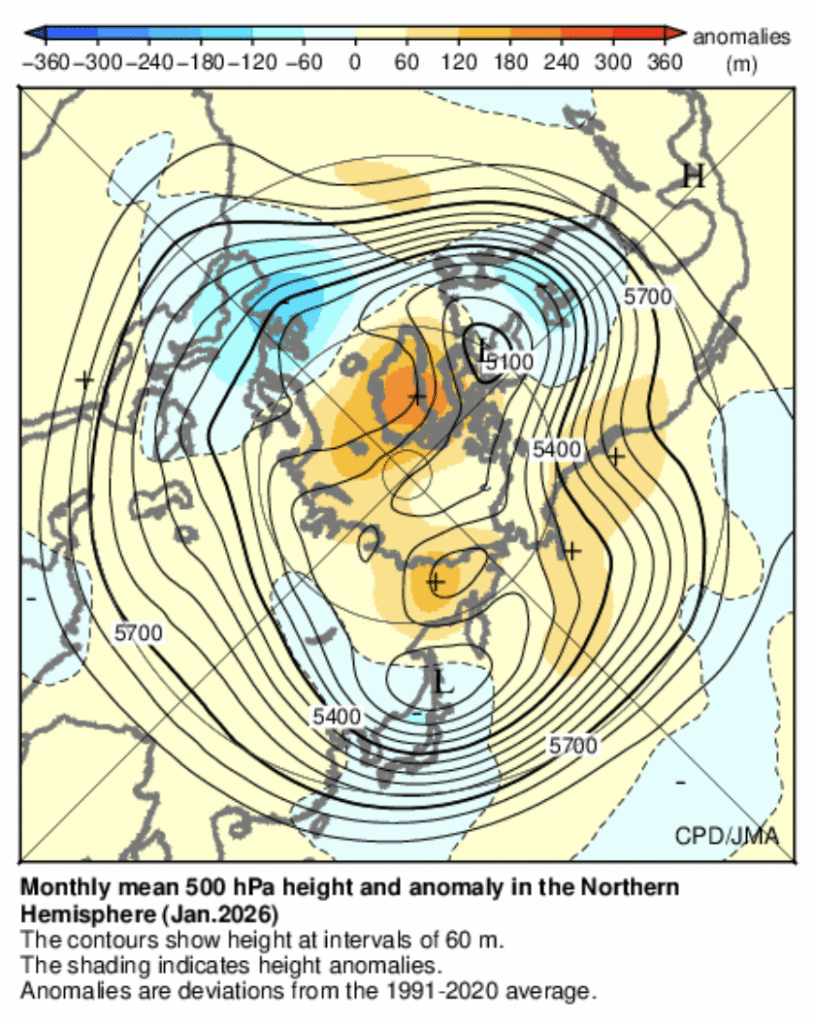
500 hPa height anomalies (Z500)
Ridging near the Aleutians extended toward East Asia, and the jet stream tended to shift northward and meander more than usual.
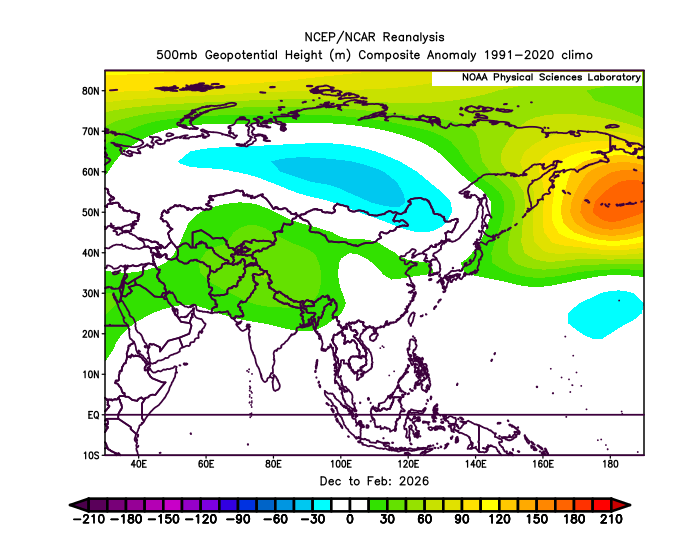
However, a notable cold push reached northern China and Japan in late January to early February.
This has been linked to a negative Arctic Oscillation (AO) and enhanced convection east of the Philippines, which may have helped amplify a wave pattern and support blocking near Alaska (see JMA reference, Japanese only).
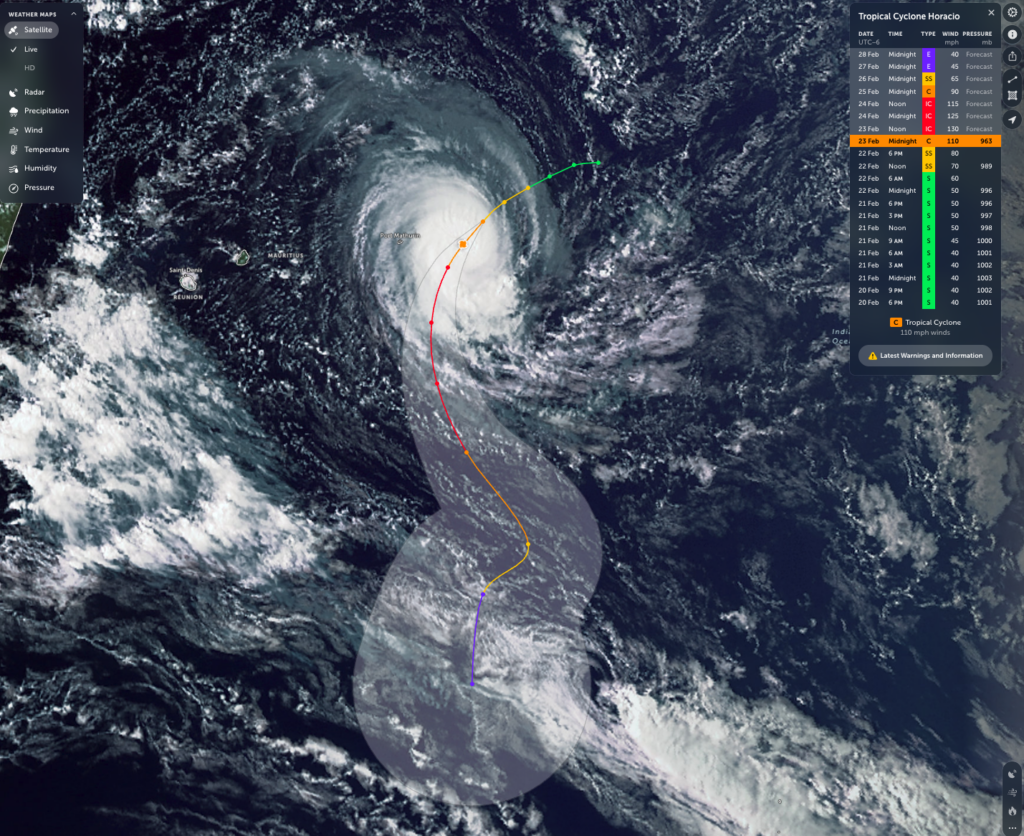
Tropical Cyclone Horacio is currently churning across the southwest Indian Ocean, east of Madagascar and near Mauritius and Réunion, displaying a well-defined spiral structure with a dense, powerful core. Satellite imagery shows tightly wound rainbands wrapping around a bright central mass of thunderstorms, a sign of an organized and strengthening system. Forecast data indicates Horacio has reached cyclone intensity, with winds around 110 mph and pressure near 963 mb at peak strength, and it is expected to gradually curve southward over open waters in the coming days. While the storm’s projected path keeps the most destructive winds offshore, outer rainbands could still bring rough seas, gusty winds, and heavy rainfall to nearby islands.
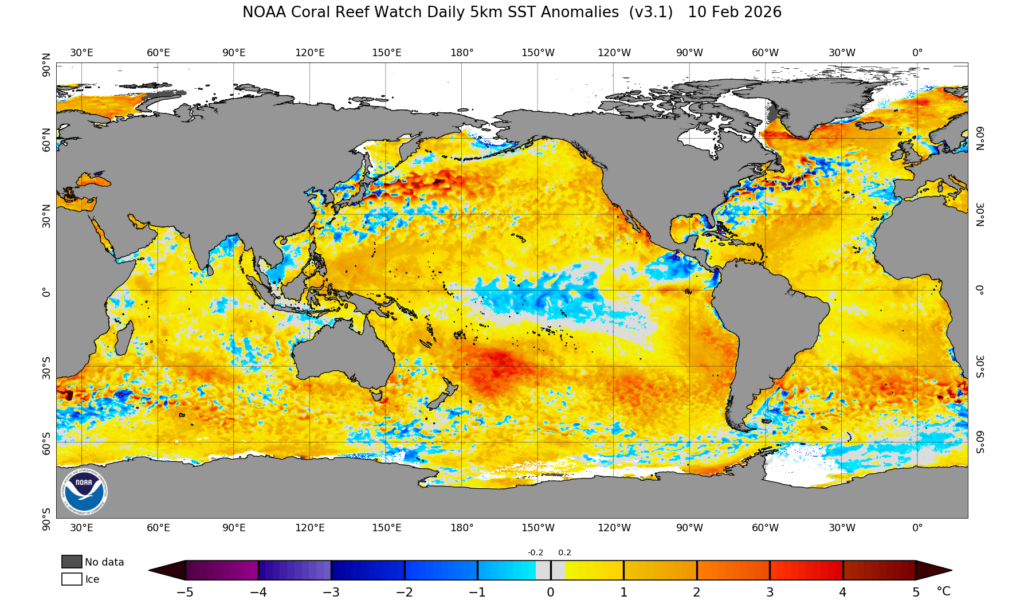
I’ve recently heard some chatter in the market and received several questions about whether warmer or cooler water temperatures around Baja California could meaningfully impact ERCOT’s summer outlook. While it’s a fair question — especially given how sensitive Texas power markets are to summer heat — the reality is that Baja sea surface temperature anomalies are rarely a primary driver on their own. There are bigger and more influential climate forces at play heading into summer 2026.
Water temperature anomalies around Baja California are often not studied in isolation, but instead as part of much larger Pacific Ocean patterns that influence weather across North America. In climate research, SST anomalies along the Baja and southern California coast are frequently embedded within broader ocean–atmosphere modes such as the Pacific Meridional Mode and the Pacific Decadal Oscillation. These patterns can extend from the northeast Pacific toward the tropics and are important because they help shape or even initiate larger climate events like El Niño and La Niña. Because Texas weather is strongly affected by these large-scale Pacific influences, Baja-region SST anomalies can sometimes serve as an indicator of broader Pacific conditions that may later impact temperature patterns farther inland — but they are typically a secondary signal rather than a standalone driver.
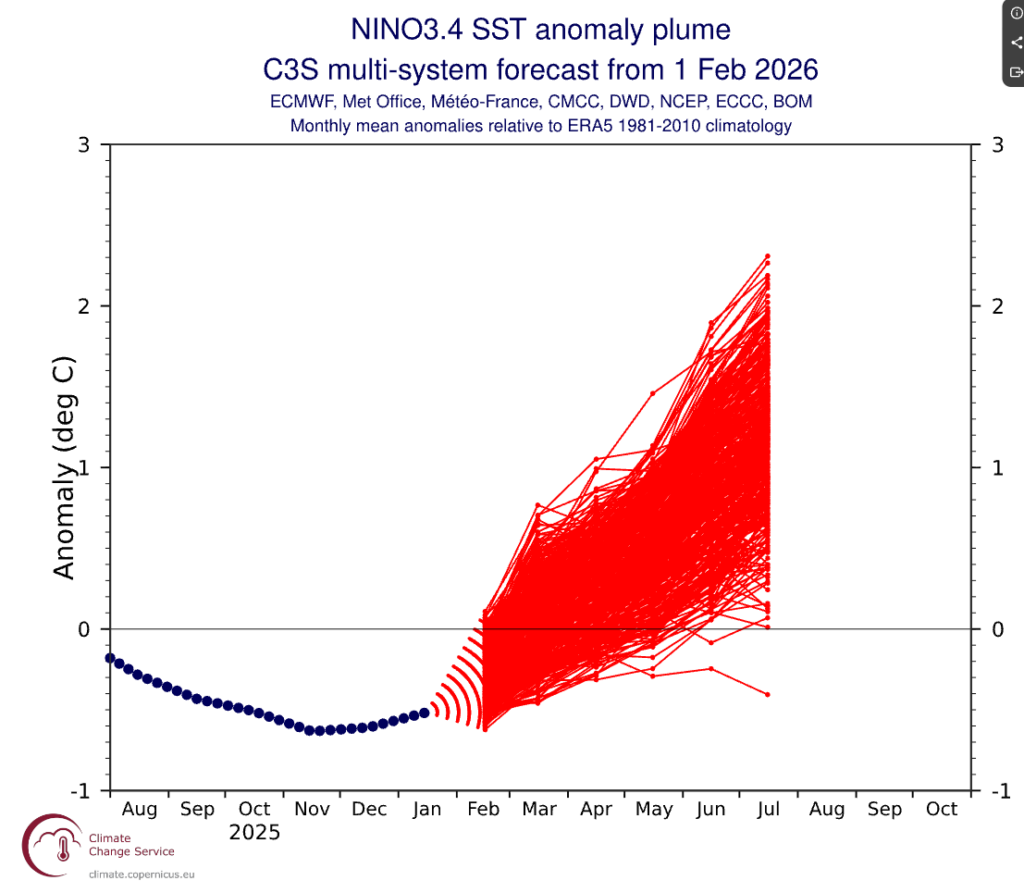
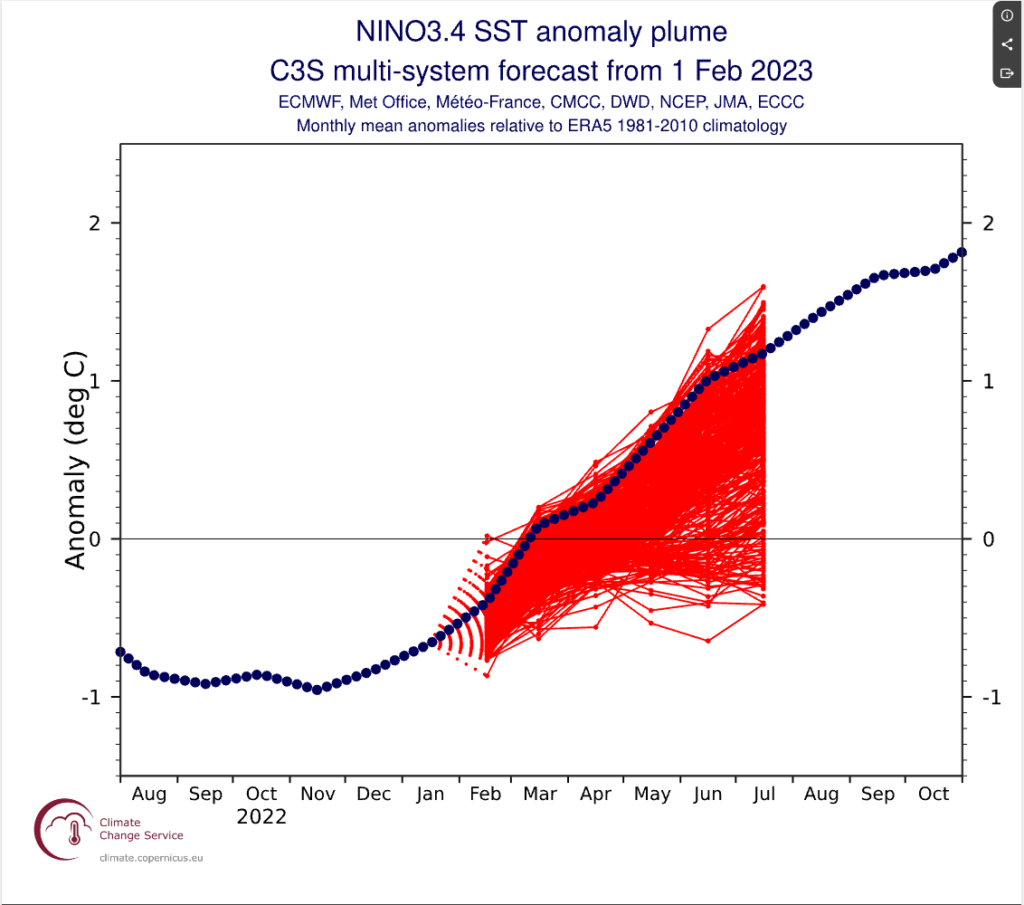
The dominant factor right now is ENSO. The current Niño 3.4 plume guidance shows a rapid transition toward a strong El Niño by late spring and summer 2026. When ENSO strengthens at that magnitude, it becomes the primary architect of hemispheric-scale circulation patterns. Strong El Niño events reshape jet stream positioning and subtropical ridging, altering storm tracks and heat distribution across North America. That larger Pacific base state will matter far more for ERCOT summer risk than marginal SST anomalies near Baja.
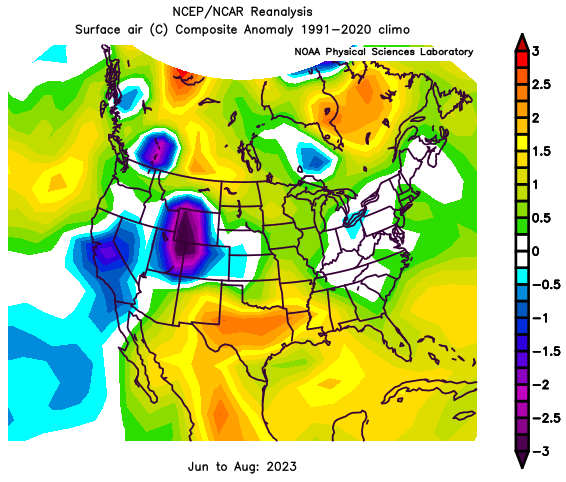
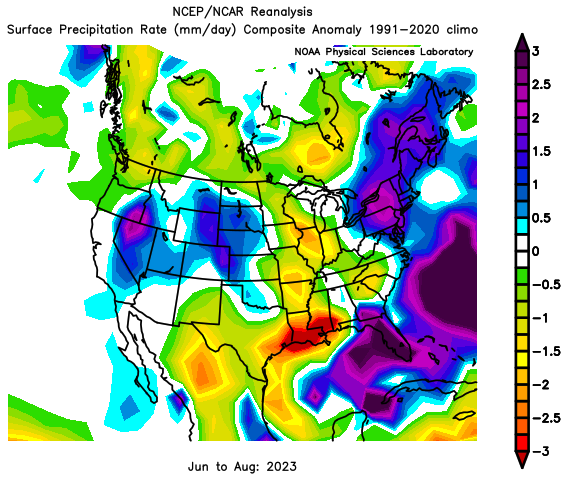
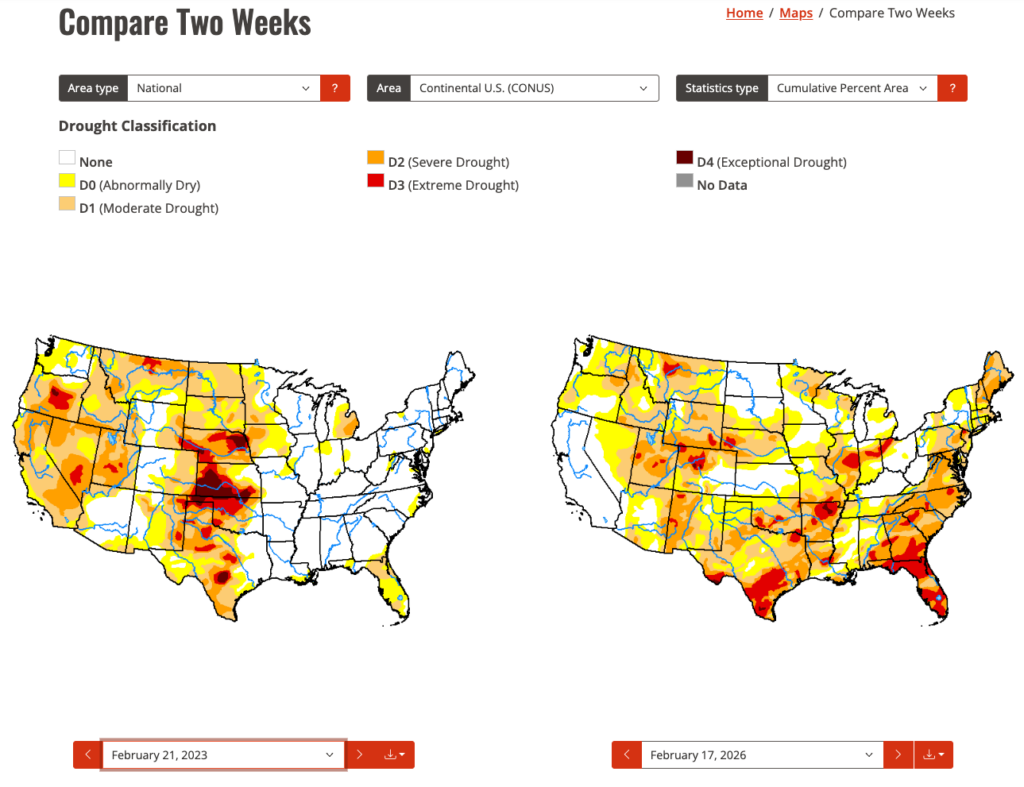
A useful analog is summer 2023. The composite reanalysis for June–August 2023 shows a distinctly hotter-than-normal signal across Texas, especially central and eastern portions of the ERCOT footprint. Precipitation anomalies during that summer were also below normal across much of Texas and the southern Plains. That combination — suppressed rainfall and persistent heat — drove elevated cooling demand and prolonged stress on the grid. The current setup shares some structural similarities, particularly in how Pacific forcing can favor ridging over the southern U.S.
JUNE-AUGUST 2023 PRECIPITATION ANOMALY
However, there is an important difference: drought conditions today are more widespread and more entrenched across parts of Texas and the southern Plains than they were in February 2023. Comparing the February 2023 drought monitor to the current map shows broader coverage of moderate to extreme drought categories. That matters because dry soils amplify heat. When the land surface lacks moisture, less energy goes into evaporation and more goes directly into warming the air. This land–atmosphere feedback can intensify heat waves and reduce afternoon cloud development, reinforcing a hotter and drier regime.
Current ocean data and seasonal forecast guidance point toward the development of a strong El Niño during summer 2026, and that shifts the discussion for Japan compared to the past two years. Japan’s summer weather plays a critical role in the global LNG market because the country is one of the world’s largest importers of liquefied natural gas. Hotter-than-normal summers drive strong electricity demand for air conditioning, which in turn increases gas-fired power generation and LNG imports. When Japan’s cooling demand surges, it can tighten spot LNG supply across Asia, influence benchmark prices such as JKM, and ripple into European gas markets as cargoes are redirected. As a result, even subtle shifts in Japan’s summer temperature outlook can have outsized effects on global LNG pricing and trade flows.
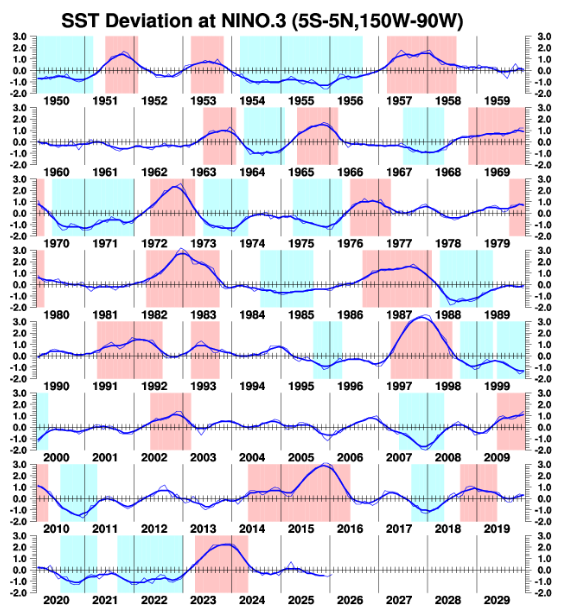
Looking back, the most recent strong El Niño peaked in late 2023 into early 2024, with Niño 3.4 sea surface temperature anomalies well above +2°C. By summer 2024, that event was already weakening toward neutral, and by late 2024 into 2025 the signal shifted slightly negative, reflecting weak La Niña conditions. As a result, summers 2024 and 2025 were not dominated by strong ENSO forcing; both occurred under weak La Niña or near-neutral backgrounds, meaning the tropical Pacific did not provide a pronounced large-scale driver.
The current C3S multi-system plume issued in February 2026, however, shows a clear upward trajectory in Niño 3.4 anomalies through boreal spring into summer, with many ensemble members reaching or exceeding +1.5°C and some approaching or surpassing +2°C by early to mid-summer. That places 2026 on track for a potentially strong El Niño.
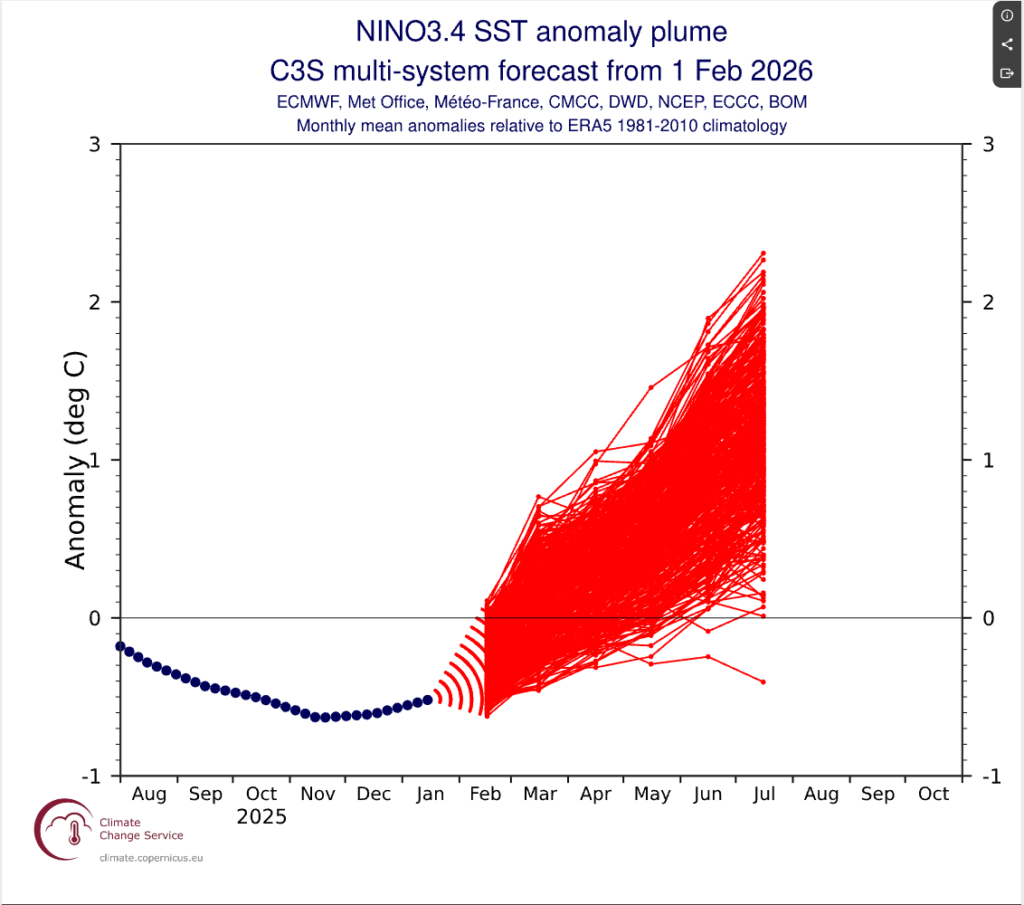
Importantly, verification of the February 2023 C3S forecast for the 2023–24 event shows that the multi-model ensemble underforecast the eventual peak strength of El Niño. The observed anomalies ultimately rose higher than many of the ensemble members had projected at comparable lead times. This underforecast bias is worth keeping in mind for 2026: if models are again slightly conservative, the eventual strength of this summer’s El Niño could exceed the current ensemble mean.
For Japan, strong El Niño summers in the past, such as 1997 and 2015 following peak events, have sometimes been associated with a tendency for a somewhat weaker or displaced Pacific High early in the season, regional shifts in baiu rainfall, and subtle changes in temperature distribution across western and central Japan. However, ENSO impacts on Japan’s summer climate are typically more muted than in winter. The strength and westward extension of the North Pacific High, Indian Ocean basin-wide warmth, mid-latitude wave patterns, and internal atmospheric variability can all amplify or override the ENSO signal. ENSO is therefore just one factor in play, even when it is strong.
This makes predicting whether summer 2026 will be hotter than summers 2024 and 2025 particularly challenging. On one hand, a strong El Niño introduces a clearer tropical Pacific signal than the weak La Niña or neutral conditions of the past two summers. On the other hand, Japan’s summer heat is strongly tied to the persistence of the Pacific High and the frequency of stagnant air masses over Honshu and Kyushu. Even with a strong El Niño, if the Pacific High intensifies and establishes prolonged southwesterly flow, extreme heat can develop. Conversely, if the subtropical high is weaker or more variable, cloudier and wetter intervals could temper seasonal averages.
Adding to this complexity is the broader background warming trend. Global and regional temperatures continue to rise, meaning the baseline upon which ENSO operates is warmer than in past decades. Summers 2024 and 2025 were already warm across much of Japan under relatively weak ENSO forcing. With a strong El Niño now expected, there is a plausible pathway to another very warm season. However, because ENSO’s summer teleconnections to Japan are indirect and often secondary to regional circulation patterns, it remains difficult to confidently state that 2026 will surpass 2024 and 2025 nationwide.
In summary, a strong El Niño appears likely for summer 2026, and past model performance suggests it could even verify stronger than currently forecast. Yet ENSO is only one driver among several. The ultimate ranking of summer 2026 in Japan relative to the past two years will depend on how tropical forcing interacts with the Pacific High, mid-latitude dynamics, and the ongoing warming climate background.
Summary: During the month, East Asia experienced a highly variable winter pattern driven by a negative Arctic Oscillation and intermittent blocking over eastern Siberia. Winter-type pressure patterns dominated early and late in the month, bringing heavy snowfall to the Sea of Japan side of Japan. Mid-month, frequent low-pressure systems tracked across northern Japan, while eastern and western Japan remained under high pressure and relatively dry. Temperatures were near normal in Japan, below normal in Korea and northern China, and above normal across much of China. Precipitation was concentrated in northern regions, while solar radiation remained strong across much of Japan, Korea, and southern China, supporting generally favorable solar generation conditions.
Synoptic pattern
Source: JMA
During the early and late parts of the month, winter-type pressure patterns frequently developed. When these patterns strengthened, heavy snowfall occurred across the Sea of Japan side of northern, eastern, and western Japan.
In the middle of the month, low-pressure systems often moved from the Sea of Japan into northern Japan, while high pressure dominated eastern and western Japan.
Throughout the month, the Pacific side of eastern and western Japan was less affected by passing lows, and northern Japan’s Pacific side was also relatively sheltered during the early and late periods.
Upper-level pattern (500 hPa GPH) and temperature anomalies
Source: JMA
At 500 hPa, a negative Arctic Oscillation prevailed. As part of this pattern, a blocking high formed over eastern Siberia, allowing part of the polar vortex to extend southward toward Sakhalin.
The polar front jet stream meandered south near Japan, periodically allowing upper-level cold air to affect the region, especially northern Japan.
At the surface, negative pressure anomalies dominated from the Sea of Japan to the Okhotsk Sea. This led to alternating periods of strong winter monsoon flow with cold air outbreaks, and periods when warm air flowed toward lows tracking over the Sea of Japan.
At times, the Siberian High extended toward western Japan and even Okinawa, reducing the influence of low-pressure systems across much of Pacific-side Japan.
Temperature
Temperatures were generally near normal in Japan, below normal in Korea and northern China, and above normal across most other parts of China.
Precipitation
Precipitation was above normal along the Sea of Japan side of Japan, northeastern China, and parts of eastern China. Elsewhere, conditions were drier than normal, with particularly dry conditions on the Pacific side of Japan.
Wind
Winds were stronger than average across much of East Asia, while the Okinawa region experienced relatively lighter winds.
Solar radiation / cloud cover
Solar radiation was stronger than normal across eastern and western Japan, Korea, and eastern and southern China, but weaker than normal in northern China.
Archives
December, 2025: https://www.ag2trader.com/1-15days/?blogPostID=189480
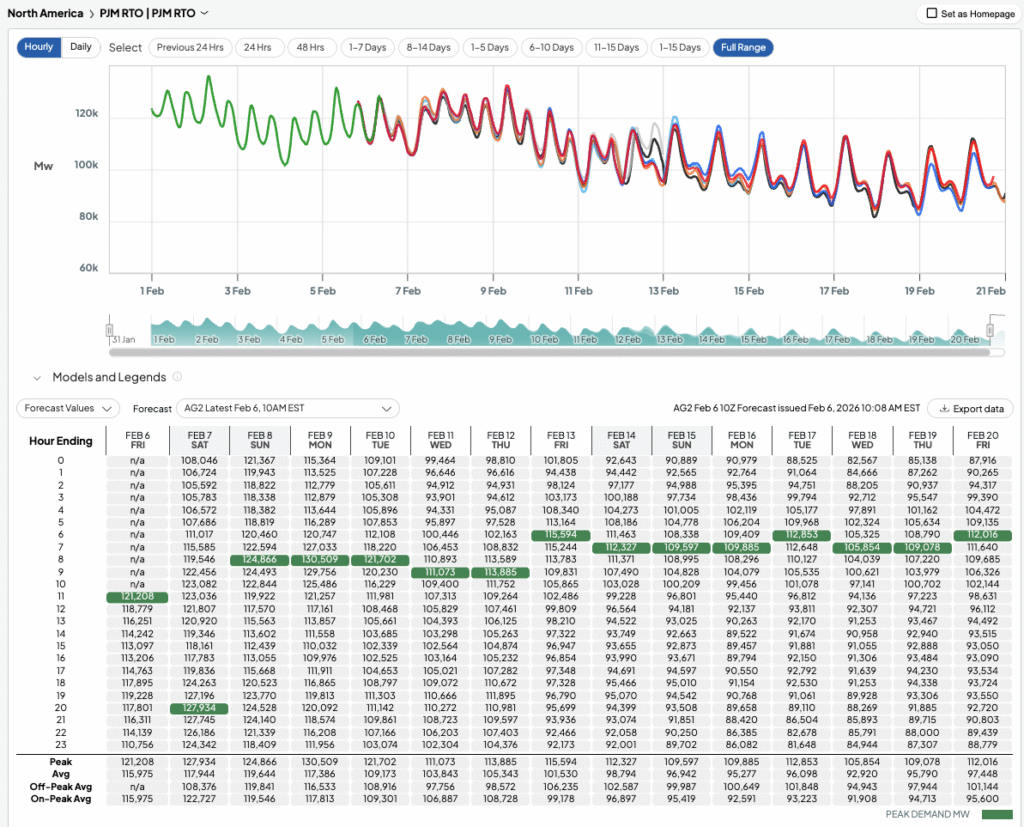
The temperature forecast across PJM shows a clear progression from colder-than-normal conditions early in the period toward a gradual moderation later on. The initial stretch of below-normal temperatures will drive higher heating demand and elevated electricity load across the region, particularly during morning and evening peak hours. As the forecast trends closer to seasonal norms and eventually warmer-than-normal conditions, heating requirements ease, which should reduce overall system demand and lessen the intensity of peak load risk compared with the cold start.
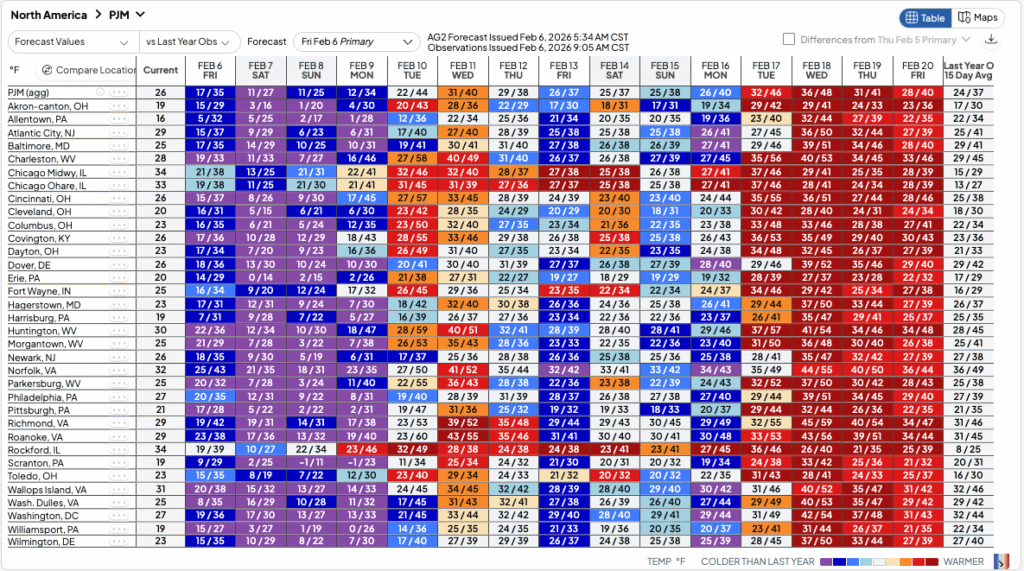
The wind generation forecast will interact with this temperature-driven demand shift by influencing how much net load PJM must serve with dispatchable resources. During the colder phase, strong wind output can provide meaningful relief by offsetting part of the increased heating load. As temperatures warm and demand pressure declines, wind variability becomes less of a stress factor, though weaker wind periods could still tighten conditions if they coincide with remaining peak hours. Overall, improving temperatures reduce the demand burden, making the system less dependent on consistently high renewable output.
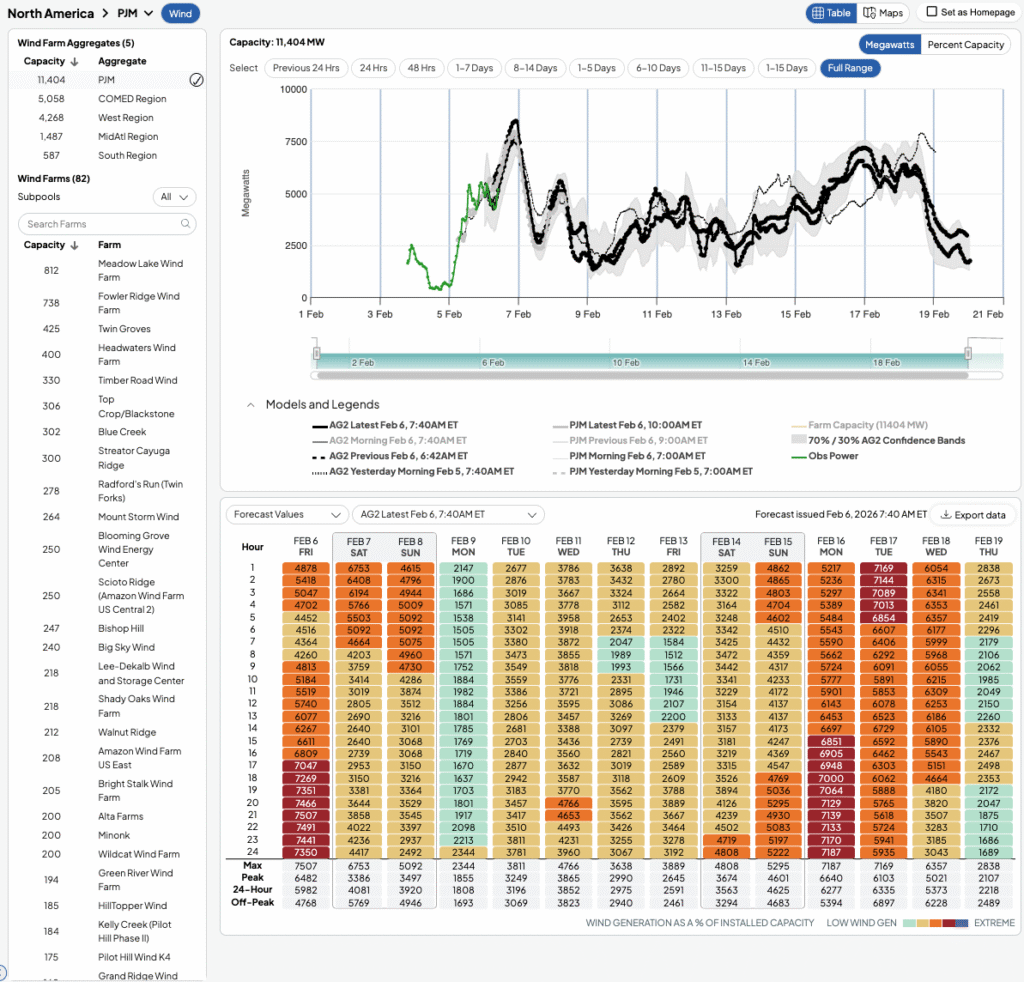
AG2’s PJM load forecast reflects this transition, with higher demand levels early in the colder portion of the outlook followed by a gradual softening as temperatures trend warmer. Daily peaks remain present throughout, but the magnitude of those peaks is expected to ease as heating load fades. This shift from cold-driven demand strength toward more moderate conditions suggests PJM will move from a higher-risk peak demand environment into a more balanced supply-demand outlook later in the forecast window.
Key takeaways from the January 2026 review:
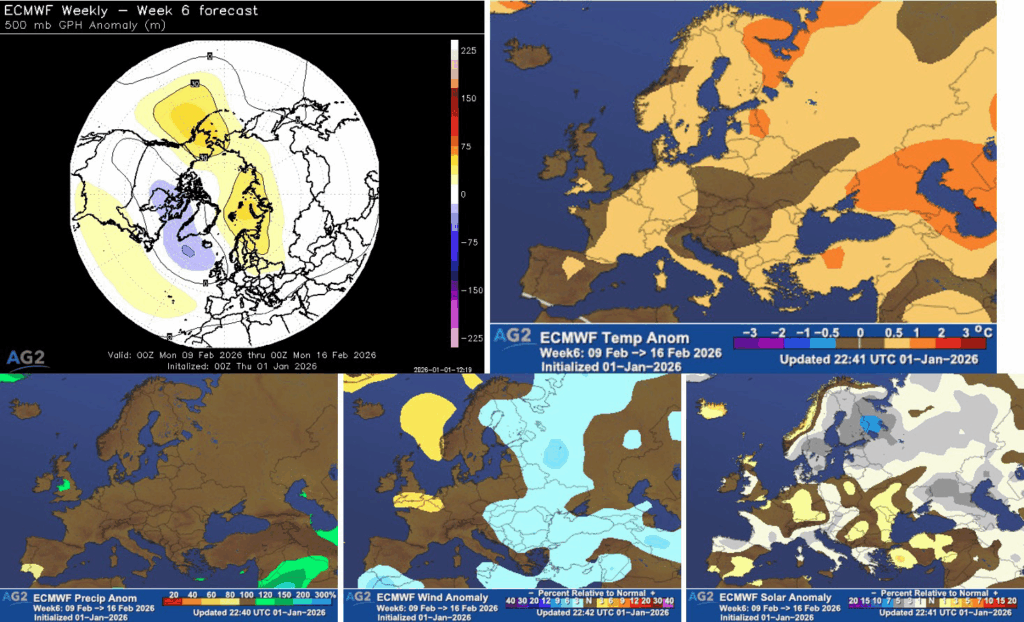
Pattern: Overall a -NAO month with higher heights to the north-east of Europe with lower heights elsewhere.
Temps: Below normal temperatures across central and north-eastern Europe – coldest anomalies to the north-east. Nearer normal to the west, above normal to the south-east
Hydro: Drier north-eastern Europe, wetter than normal elsewhere.
Wind: Windiest southern Europe. Lower winds north.
Solar: Mostly below normal, except slightly above to the north-east.
C3S verification: Poor forecast with above normal temperatures forecast widely, highest anomalies to the north-east.
The NAO index through January is shown below. A -NAO initially to begin the month quickly trended to near neutral to mid month before then a downwards trend back to -NAO values through the second half of the month.

The 500mb geopotential height anomalies and corresponding temperature anomalies for the month of January are shown below. Overall, a -NAO due to higher heights across Greenland/Iceland. However, troughing dominated Europe, centred across the north-west, while higher heights were observed across north-eastern Europe. A very colder month across north-eastern Europe with temperatures well below the climatological normal here. Temperatures were nearer normal across western Europe, while above normal temperatures were observed across the south-east.
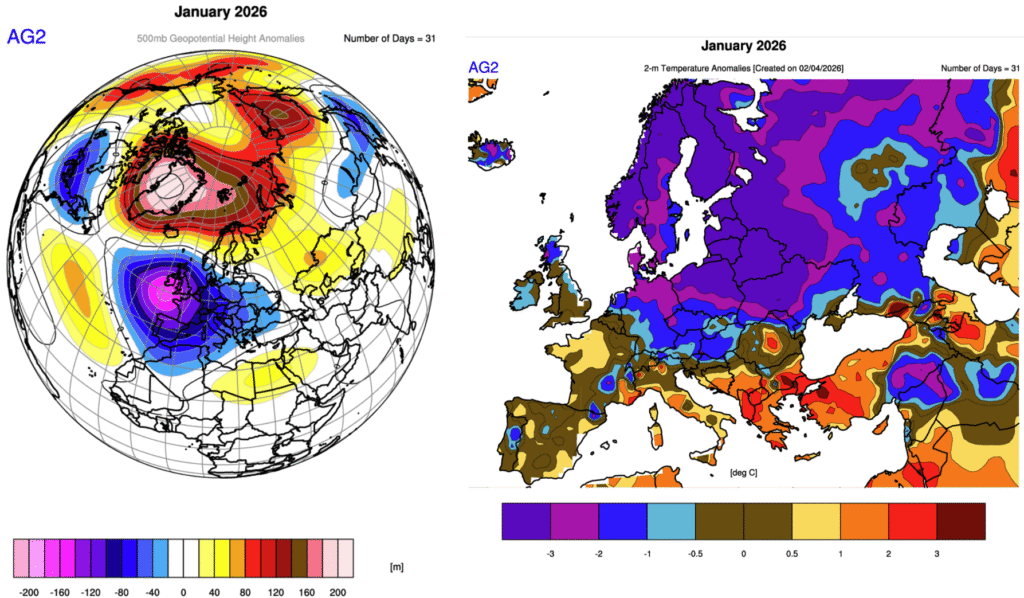
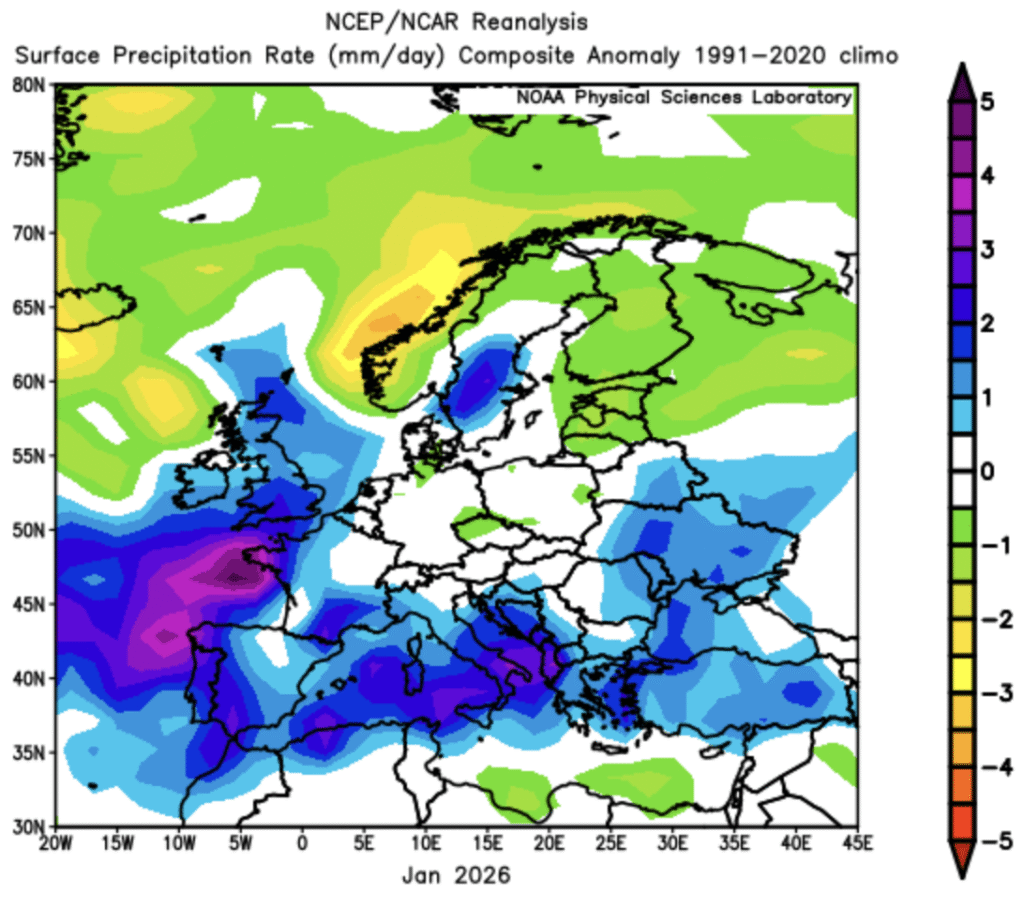
With regards to precipitation, drier conditions were observed to the north-east, with wetter conditions across western and southern Europe.
While for winds, the windiest conditions were across southern Europe with lower winds across the north.
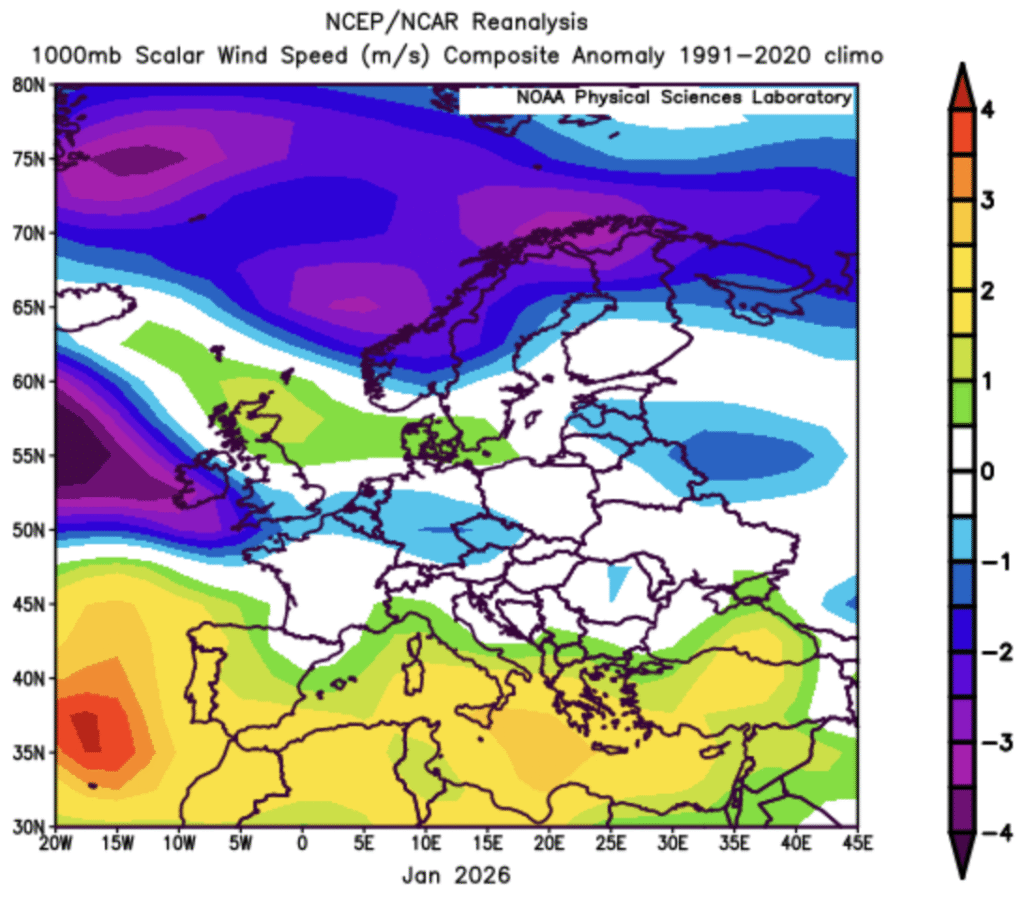
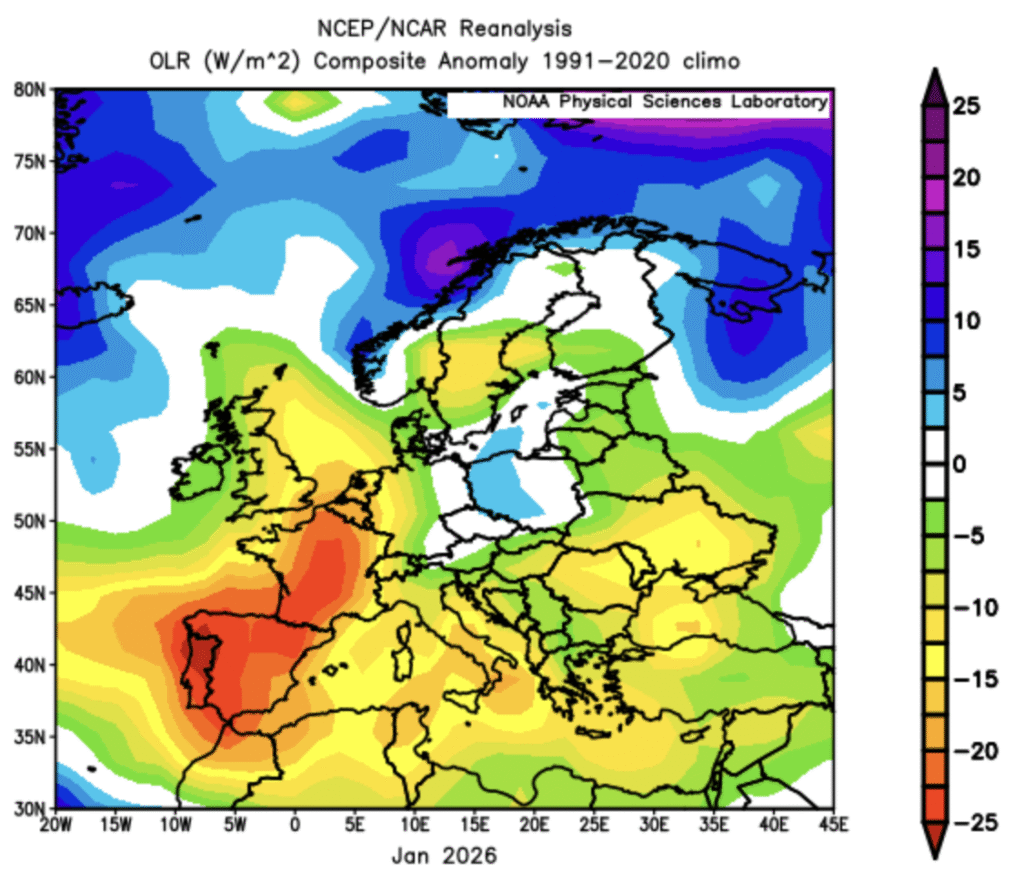
Outgoing Longwave Radiation (OLR) is used here as a proxy for solar. A small region of positive solar generation anomalies (blues/purples from positive OLR) can been seen across north-eastern mainland Europe. While negative anomalies (warmer colours from negative OLR anomalies) were observed across western and southern Europe under cloudier skies here.
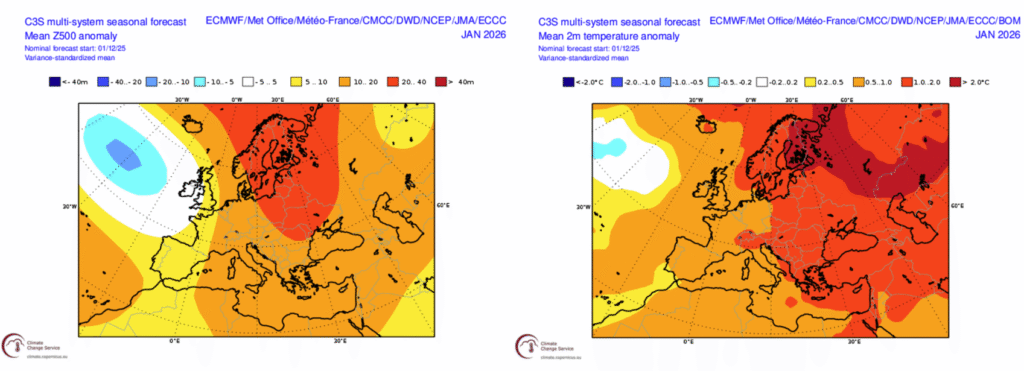
Now looking back at how well the C3S model forecast the month of January. Generally lower pressure was forecast to the north-west of Europe with higher pressure forecast to dominate elsewhere across much of Europe. When in reality, low pressure dominated across much of the continent. A poor forecast in terms of temperatures with the C3S model forecasting widely above normal temperatures while actual anomalies were the opposite of this, with the coldest anomalies to the north-east.
With more tamed cold risks coming from the stratosphere in February (more likely due to the lack of coupling with the troposphere), a more linear and reliable MJO signal could set us up for colder risks in March. We should monitor any slower downward propagation from the stratosphere, as it could align with that potentially colder MJO forcing in March.
In the light of recent events, the MJO is continuing to prove itself a very reliable predictor/driver in the sub-seasonal space this winter.
The recent fervent pulse of tropical convection over the W Hem, currently proceeding into Africa has triggered spells of cold weather across many high energy demand regions of the N Hem. The expectations for it to move through the Indian Ocean, Maritime Continent, and W Pac later in February supports the recent milder moves, which are finding less opposition from the stratosphere (https://www.ag2trader.com/1-15days/?blogPostID=189749).
Given the fairly large magnitude of the current MJO wave, we can assume that its rather linear E’ward propagation could bring that train of waves back towards regions where we typically observe a downward forcing to the NAO/AO set of indices (W Hem through Africa) sometime in March (mid-month?).

Meanwhile, while expectations for quick stratosphere-troposphere coupling are fizzling out for the upcoming SSW event, if we argue that the November SSW event had slow downward propagation through the atmosphere, is there a risk that we could see new forcing from the start towards colder risks again in March?

After shifting more zonal and less blocked, the yesterday’s EC46 run brought back more blocked patters in its higher clusters towards the close of the run, with a “bridge ridge” in the leading position.
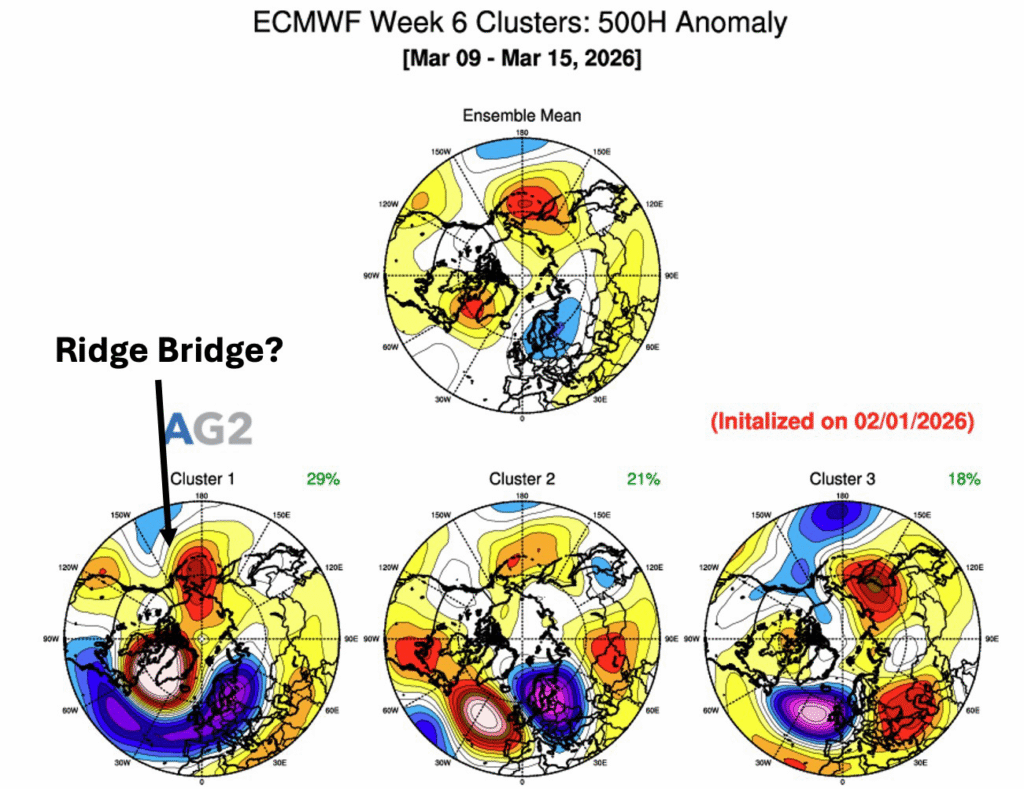
In Europe, those top clusters are pretty cold, to mention the lowest one…
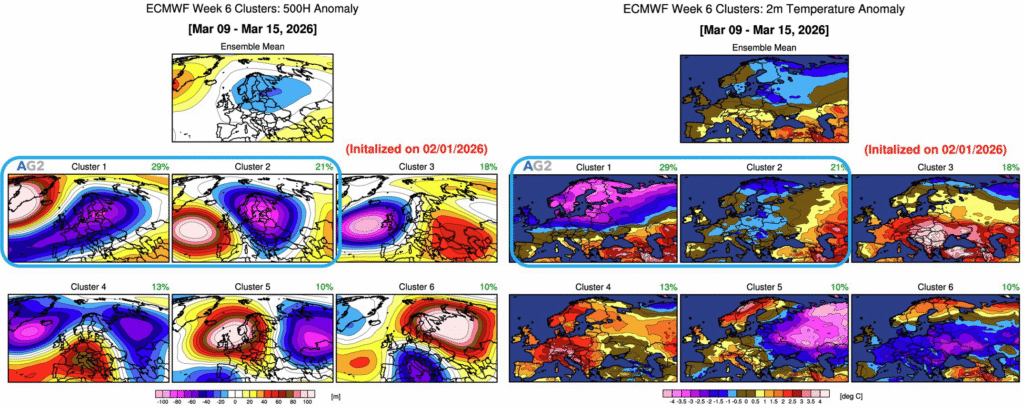
Bottom line: With the February cold signal increasingly damped by missed strat–trop coupling, the focus now shifts to March as the next window for meaningful cold risk. A strong, cleanly propagating MJO wave is being a key driver of this winter’s weather, now heavily skewing risks to the milder side later in Feb. But given the amplitude of the MJO wave, we are led to project colder forcing again some time into March, once it circles back into the NAO/AO-sensitive sectors. Also, if any slow downward influence from the upcoming SSW event lines up with that MJO forcing, the door could reopen more easily to renewed blocking and a late-season cold pulse – a risk echoed by yesterday’s EC46 higher-probability clusters, which return to a “bridge-ridge” style pattern, and colder scenarios especially for Europe.
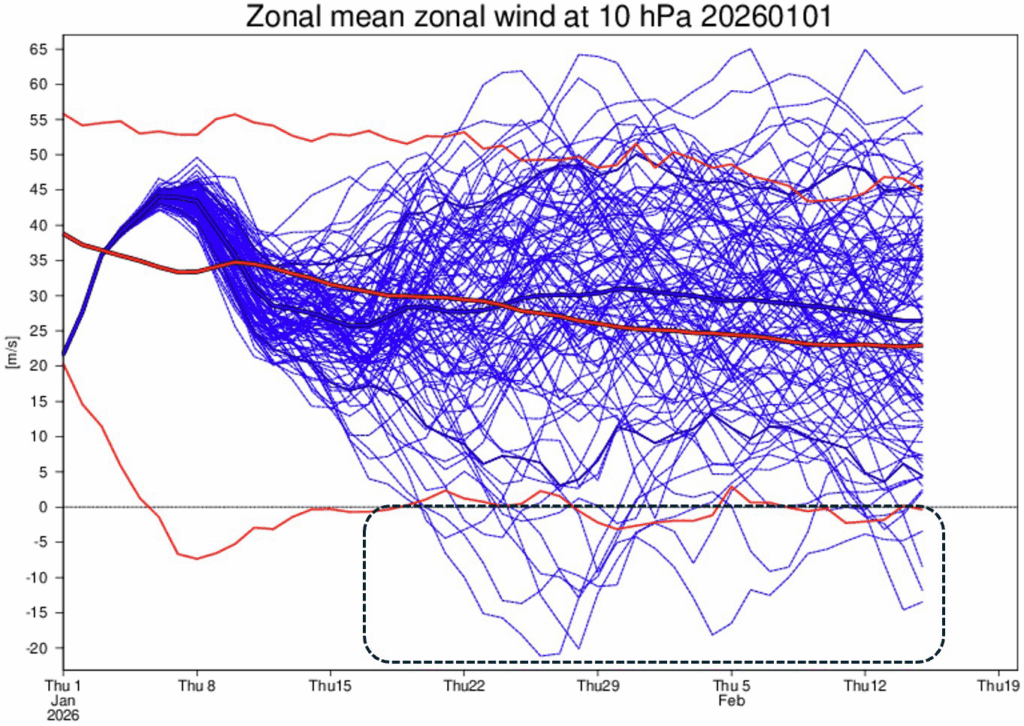
Sudden Stratospheric Warming (SSW) events often attract significant attention, especially during winter, because they are sometimes associated with major cold outbreaks in the mid-latitudes. However, SSW-related charts and headlines are frequently misinterpreted. This article aims to clarify what common SSW diagnostics actually indicate — and what they do not.
SSW Does Not Automatically Mean Immediate Surface Impacts
An SSW is primarily a stratospheric phenomenon, characterized by a rapid warming of the polar stratosphere and a weakening or reversal of the zonal mean westerly winds near 10 hPa at high latitudes.
Crucially, the occurrence of an SSW does not imply an immediate impact on surface weather. While some SSWs are followed by notable tropospheric responses, others have little to no detectable influence at the surface. Even when an impact does occur, it typically emerges weeks later, not immediately.
Interpreting the 10 hPa Zonal Wind Ensemble Chart
Charts showing ensemble forecasts of zonal winds at 10 hPa are often used to assess SSW risk. These charts are useful for identifying the probability of a weakening or reversal of the stratospheric polar vortex.
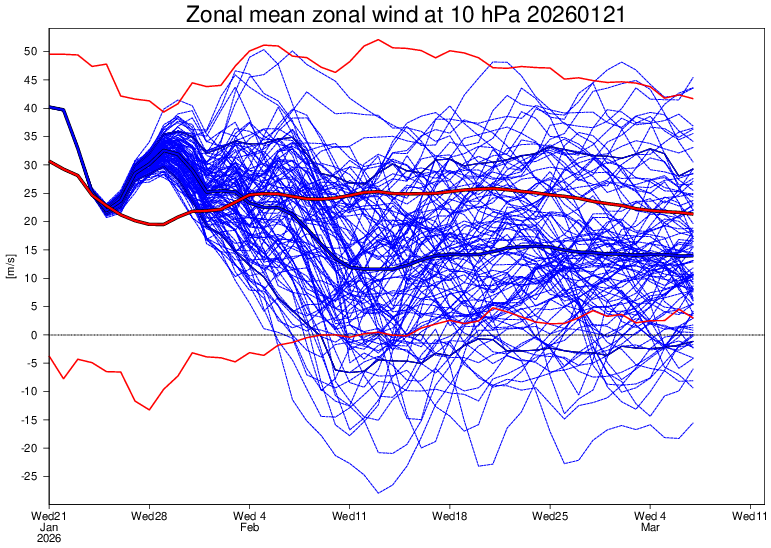
However, they should not be interpreted as direct indicators of surface temperature outcomes. A projected wind reversal at 10 hPa signals an increased likelihood of an SSW event — nothing more.
Will the SSW Signal Propagate Downward?
Whether an SSW affects the troposphere depends on whether its signal propagates downward over time. This is not guaranteed.
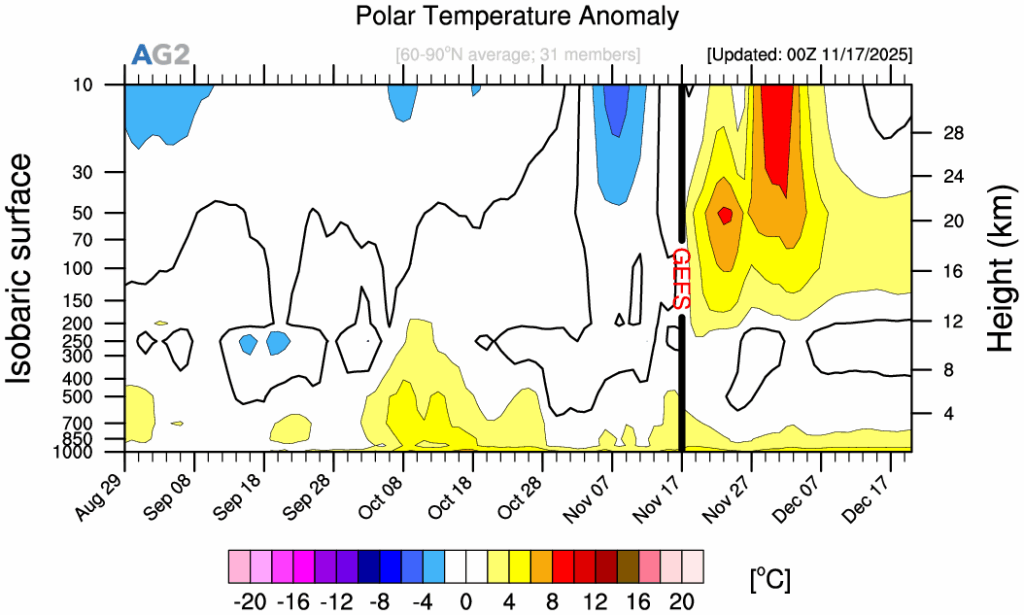
One way to assess this potential is by monitoring polar temperature anomaly maps, which can reveal whether stratospheric anomalies are descending from the upper stratosphere toward the lower stratosphere and eventually into the troposphere.
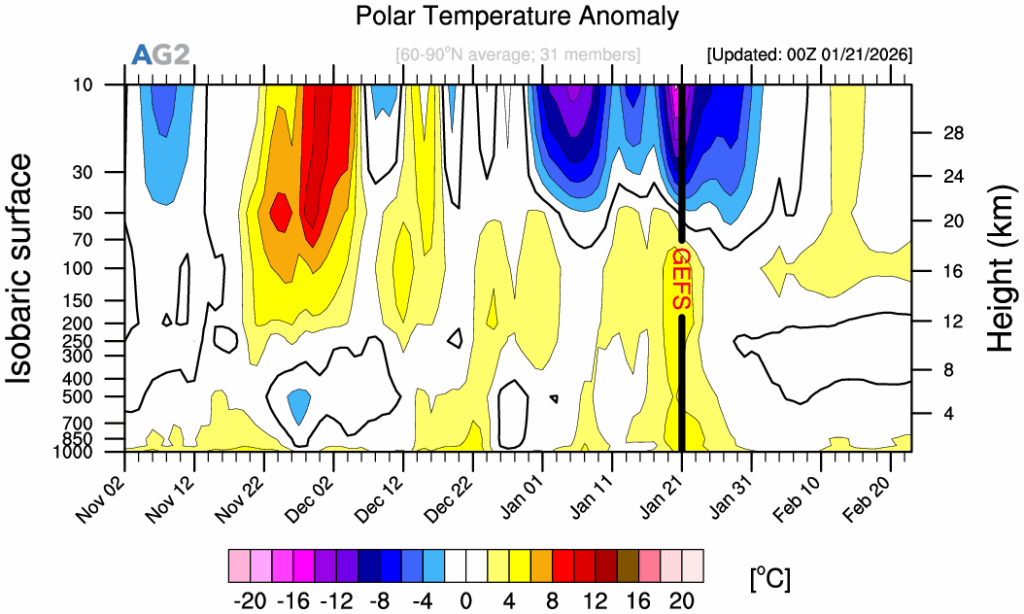
AG2 Trader has a Polar Temperature Anomaly maps to evaluate whether the SSW event affect the troposphere.
https://www.ag2trader.com/sub-seasonal/diagnosticTools/PolarTempAnomalies
Only when such downward propagation occurs does an SSW become relevant for surface weather patterns.
SSW Alone Does Not Determine Where Cold Air Will Go
A common misconception is that an SSW event determines where Arctic cold air will be displaced — toward North America, Europe, or East Asia. In reality, SSW alone does not answer this question.
Regional impacts depend on the tropospheric circulation pattern at the time when (and if) the stratospheric influence reaches the troposphere. The configuration of ridges and troughs ultimately governs where cold air outbreaks occur.
As a result, SSWs have been followed by:
- Cold spells in North America,
- Cold spells in Europe,
- Cold spells in East Asia,
- Or, in some cases, relatively mild conditions across all regions.
Persistence of Circulation Patterns After SSW
When an SSW does influence the troposphere, the resulting ridge–trough pattern often shows enhanced persistence, lasting several weeks. This persistence is well documented, but the underlying physical mechanisms are not yet fully understood and remain an active area of research.
This persistence is one reason SSWs are closely monitored in subseasonal forecasting, even though their impacts are probabilistic rather than deterministic.
Regional Perspective: North America, Europe, and East Asia
From a regional standpoint, SSW impacts can differ markedly:
- In some cases, cold air is preferentially directed toward North America or Europe.
- In such situations, East Asia may experience a ridge-dominated pattern, leading to relatively warm and stable conditions.
- Conversely, East Asia can experience significant cold outbreaks if the tropospheric pattern favors troughing in that region.
Therefore, the mere occurrence of an SSW does not allow us to conclude whether a specific region will experience colder or warmer conditions.
Stratospheric Temperature vs. Surface Temperature: No Simple Relationship
Finally, it is important to emphasize that there is no strong direct or immediate correlation between stratospheric temperature anomalies and surface temperature anomalies.
Any surface impact associated with SSWs is generally indirect, mediated through changes in large-scale circulation patterns such as the Arctic Oscillation (AO) or North Atlantic Oscillation (NAO), rather than a simple one-to-one temperature relationship.
Key Takeaways
- SSWs are stratospheric events and do not guarantee surface impacts.
- 10 hPa zonal wind charts indicate SSW risk, not surface temperature outcomes.
- Downward propagation must occur for tropospheric impacts to emerge.
- Regional cold or warm anomalies depend on tropospheric circulation, not on SSW alone.
- Surface impacts, when they occur, are indirect and probabilistic.
Understanding these limitations is essential for correctly interpreting SSW-related forecasts and avoiding overconfident conclusions about regional weather outcomes.
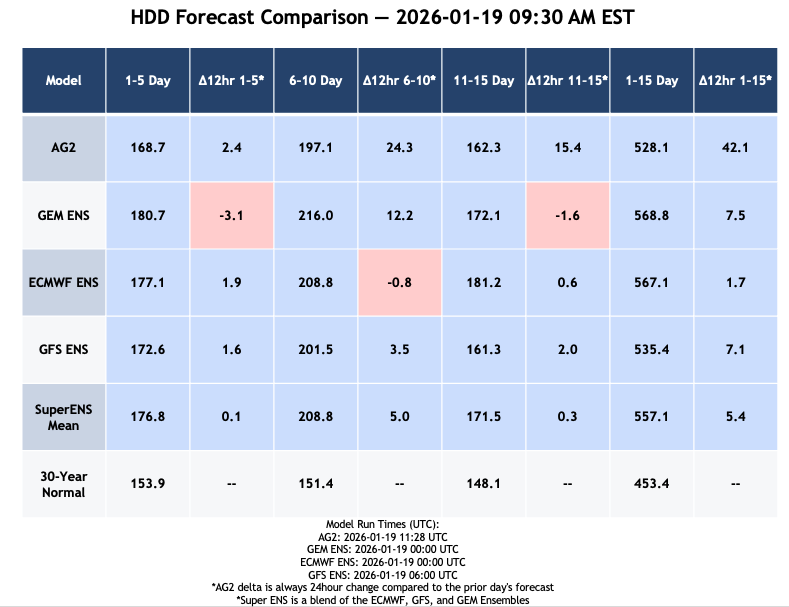
The 12 day national demand change since Friday is +41.9 HDDs…
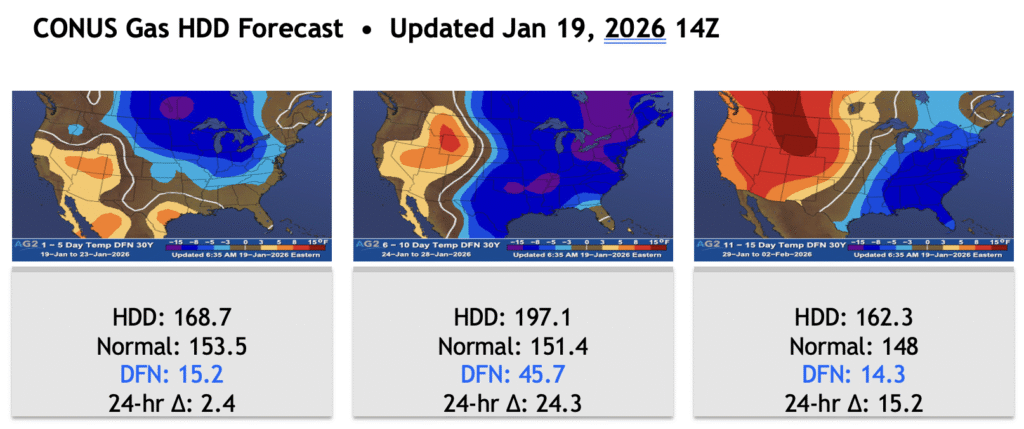
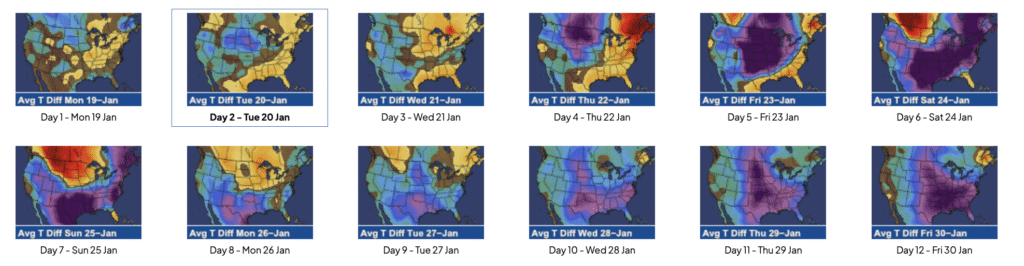
Modeled temperature anomalies for the next 15 days are below. Modeling offers a colder risk in the East through most of the period now with two distinct peaks – the first through Jan 20, and the second Jan 23-30. This second shot is mostly due to the EPO trending more (-) allows the ceiling to end January to rise quite a bit.

Our period maps are below noting very cold changes compared to Friday.
Changes since Friday, by day, are below for the next 12 days.
The stronger push of cold into Texas is driving a lot of these changes, in addition to the colder Midwest and Northeast trends. Look at these forecast changes in ERCOT since Friday.
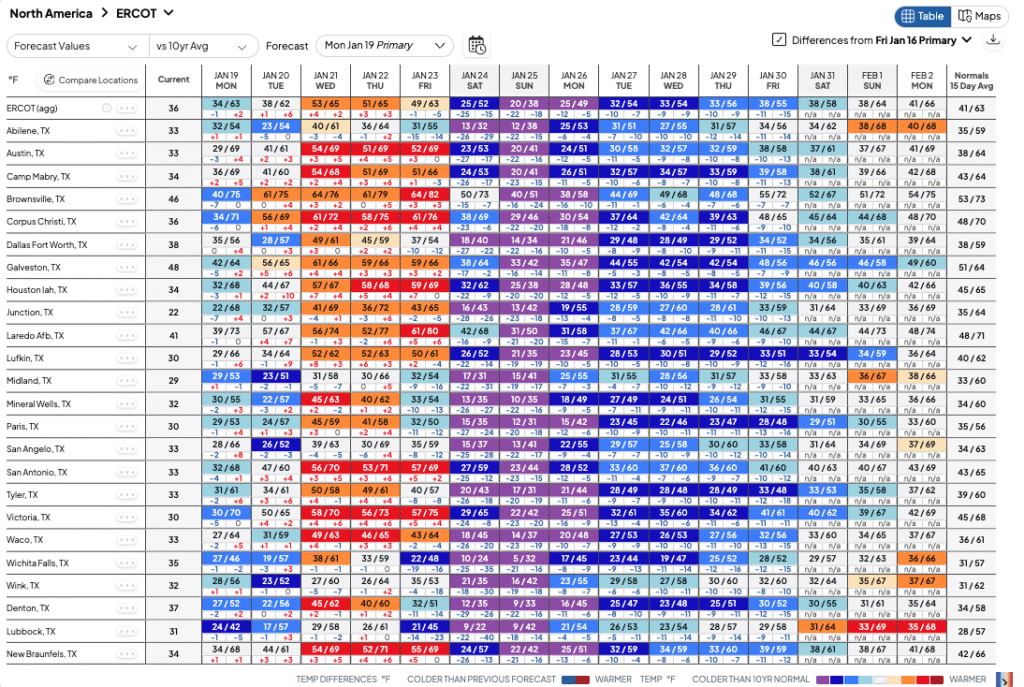
HDDs rebound with two distinct peaks – the first through Jan 20, and the second Jan 23-30. There is a high chance we see a few 40 HDD days during the second peak, with our forecast offering multiple now. The 11-15 day sees HDDs slowly return closer to the 30 year normal as the EPO trends back positive and cold dissipates.
Our January HDD number is up to 938 (!!) given the colder weekend changes.
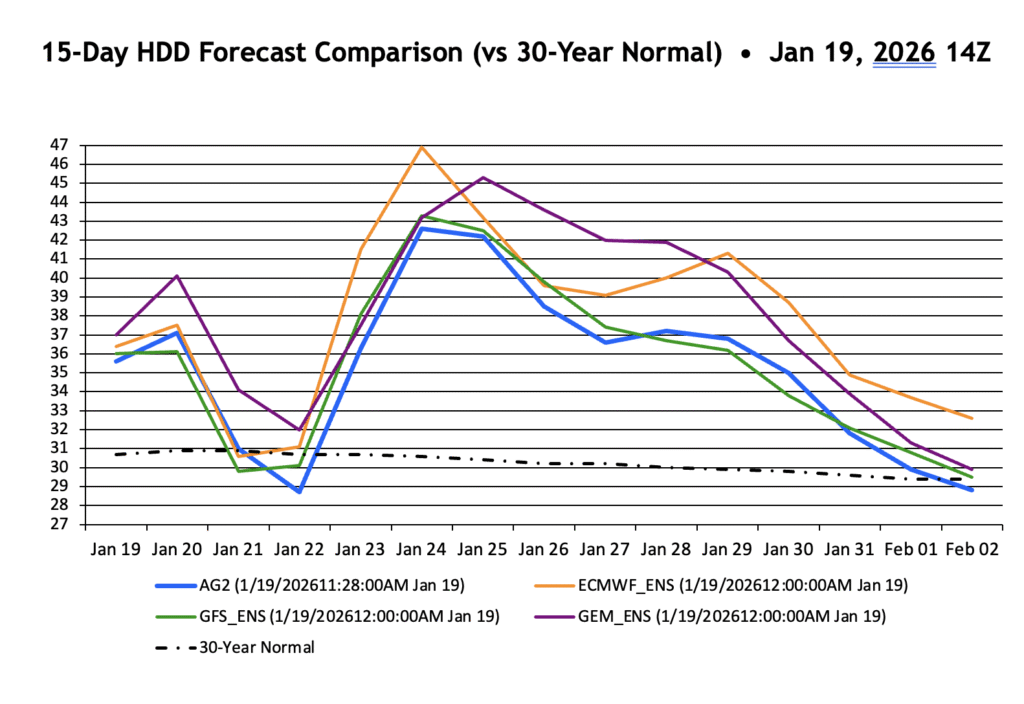

There is also likely a snowcover bias ongoing with ECMWF data, which is likely the cause of the colder outlook on this suite, by 30+ HDD in some cases. We favor a blend of data at this time.
Looking at day 15, February 2, there is still quite a bit of blocking near the Pole and Greenland, but the -EPO AK ridge is breaking down and being replaced with troughing. The result is a lingering cold in the Northeast, but much of the CONUS is warming.
The week of 2 FEB continues to suggest a marked warmer transition, but notice the week of 9 FEB is colder with more blocking again. We will continue to monitor.

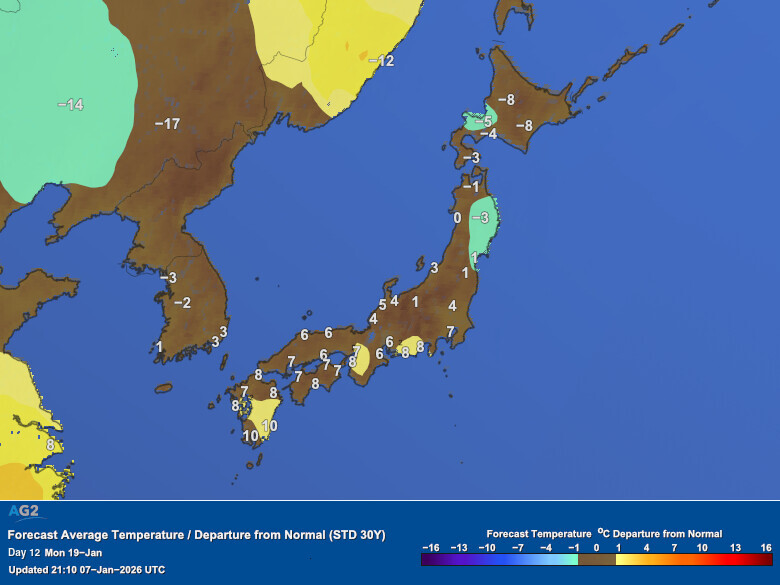
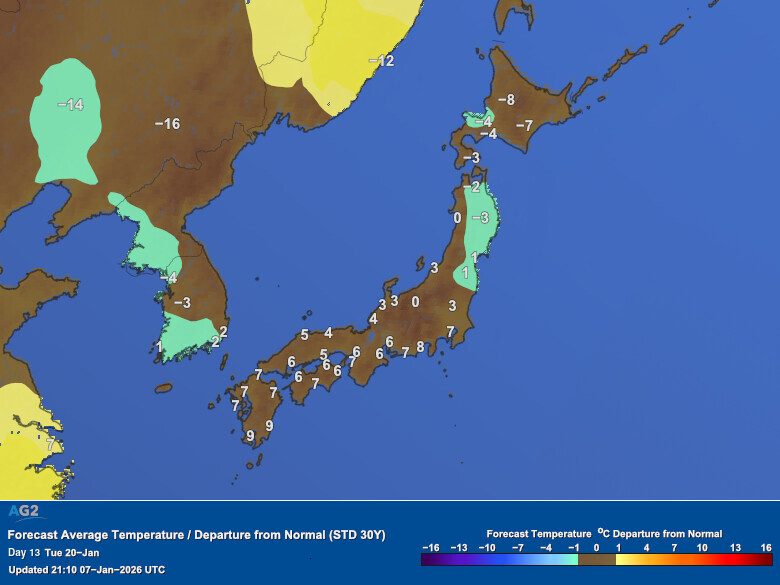
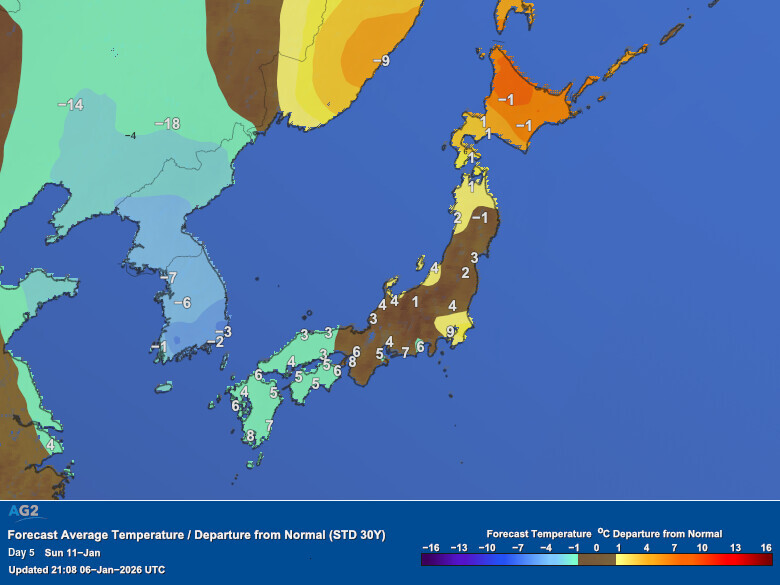
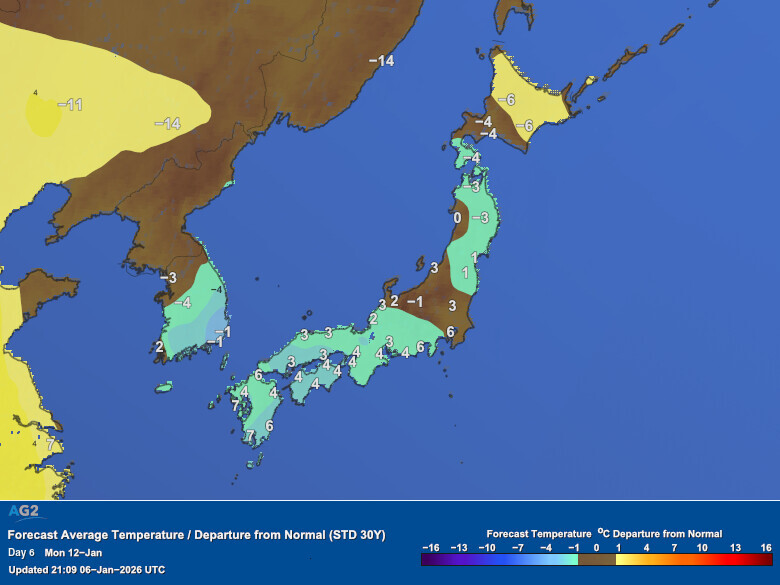
From Monday the 19th onward, temperatures across Japan are currently forecast to be near normal, except for parts of northeastern Japan.
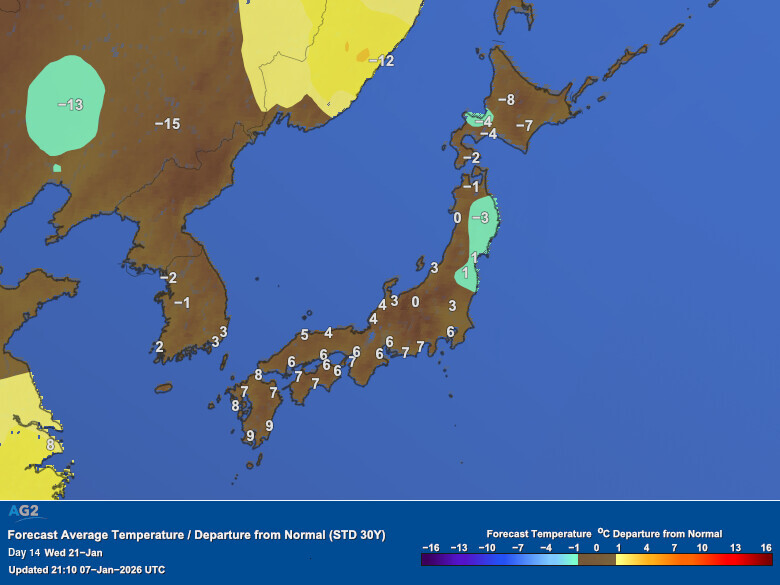
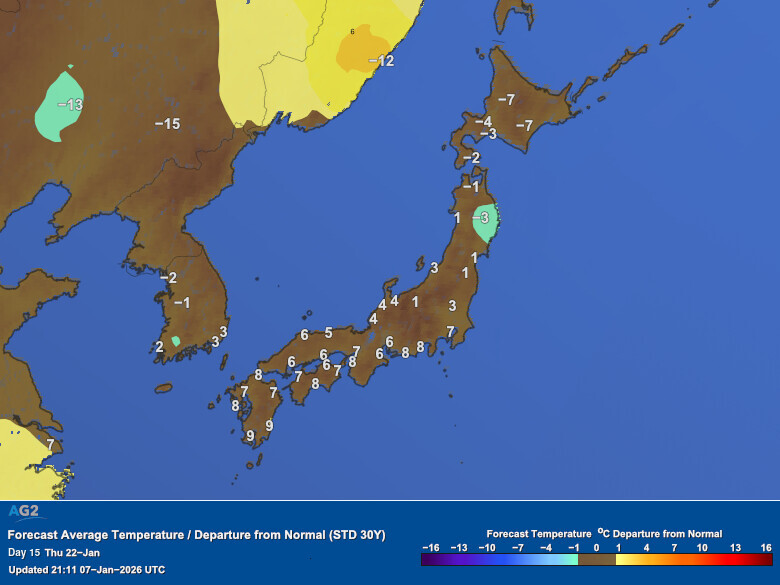
However, the key question is whether this outlook is stable—or if there is potential for change.
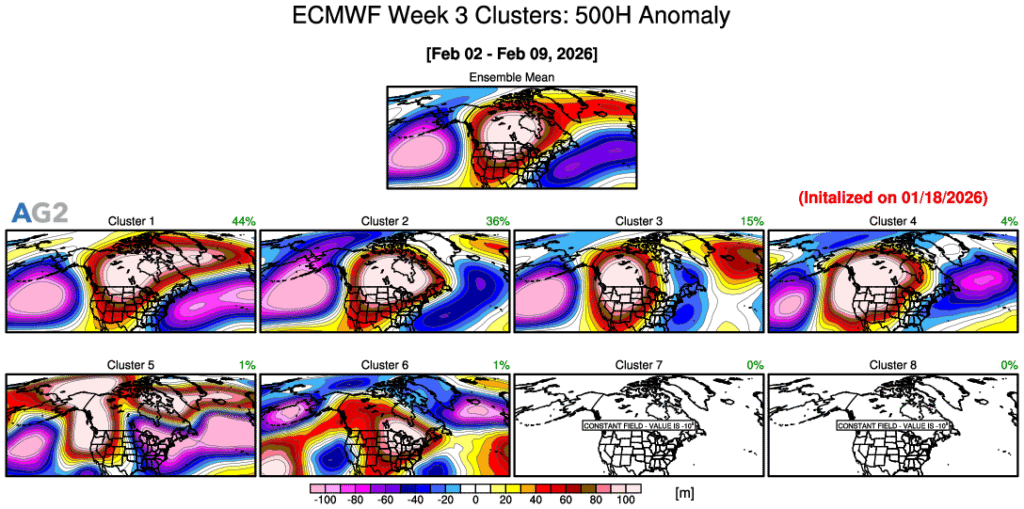
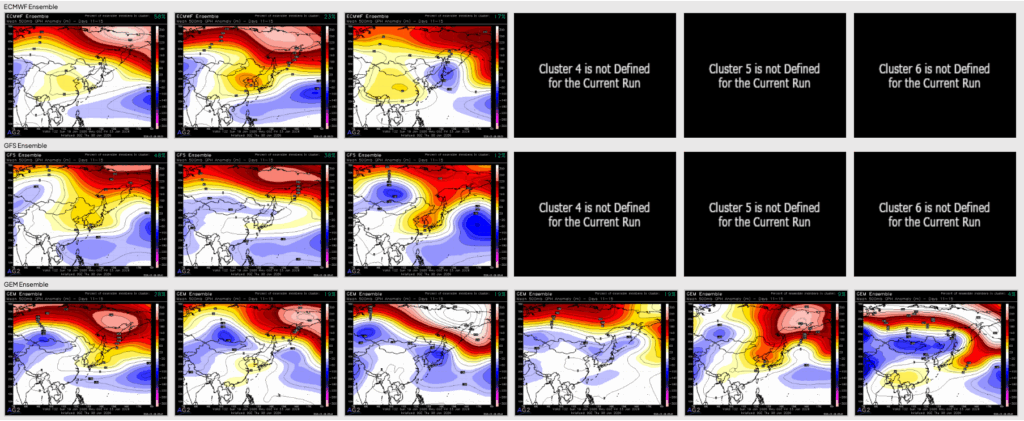
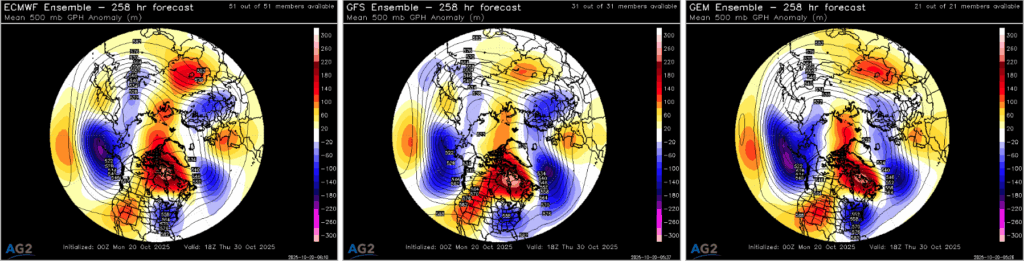
Looking at the latest 500mb geopotential height anomaly ensemble clusters from ECMWF, GFS, and GEM, there is a mix of scenarios. Some clusters show negative anomalies over Japan, while others show positive anomalies, indicating ongoing uncertainty in the upper-level pattern.
In addition, mean sea-level pressure ensemble forecasts show some members with north–south aligned isobars near Japan, which suggests a possible shift toward a winter-type pressure pattern. This pattern could persist through around the 23rd.
Although confidence is still limited given the 10+ day lead time, it is important to monitor the risk of:
- A persistent winter-type pattern after the 19th,
- Below-normal temperatures across much of Japan, and
- An increased risk of heavy snowfall along the Sea of Japan coast.
This period warrants close attention as forecast confidence improves.
Over the next two weeks, Japan is expected to see repeated short cold spells. A strong cold air outbreak will affect the country during the long weekend, bringing more wintry conditions. However, the impact will vary by region.
In western Japan, colder-than-normal temperatures are expected on Sunday and Monday due to strong Siberian cold air.
Meanwhile, northern Japan and the Sea of Japan side of eastern Japan face an increased risk of heavy snowfall, both in lowlands and mountainous areas.
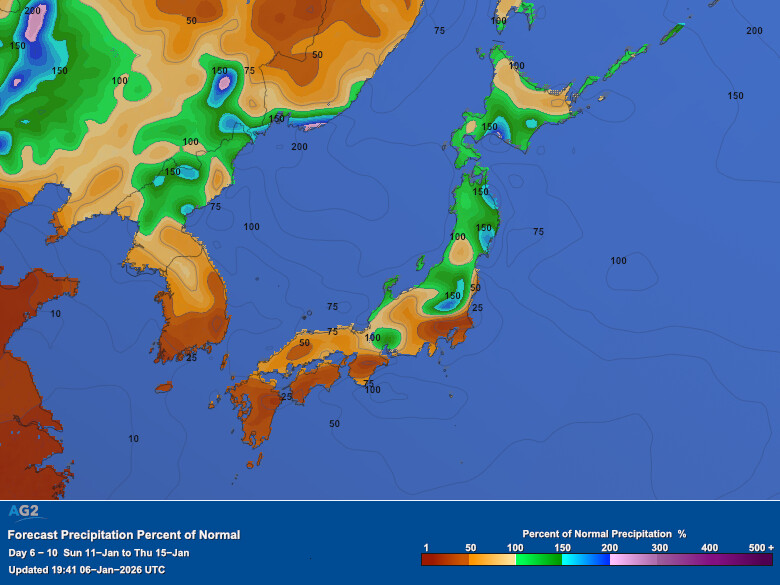
Precipitation has already been above normal along the Sea of Japan coast, and snowfall may increase further on Sunday and Monday.
What is driving these repeated cold intrusions? The pattern appears to be influenced by both tropical and Arctic factors.
From the tropical side, the Madden–Julian Oscillation (MJO) is currently in Phase 5 near the Maritime Continent.
Historically, this phase is associated with cooler-than-normal conditions in Japan.
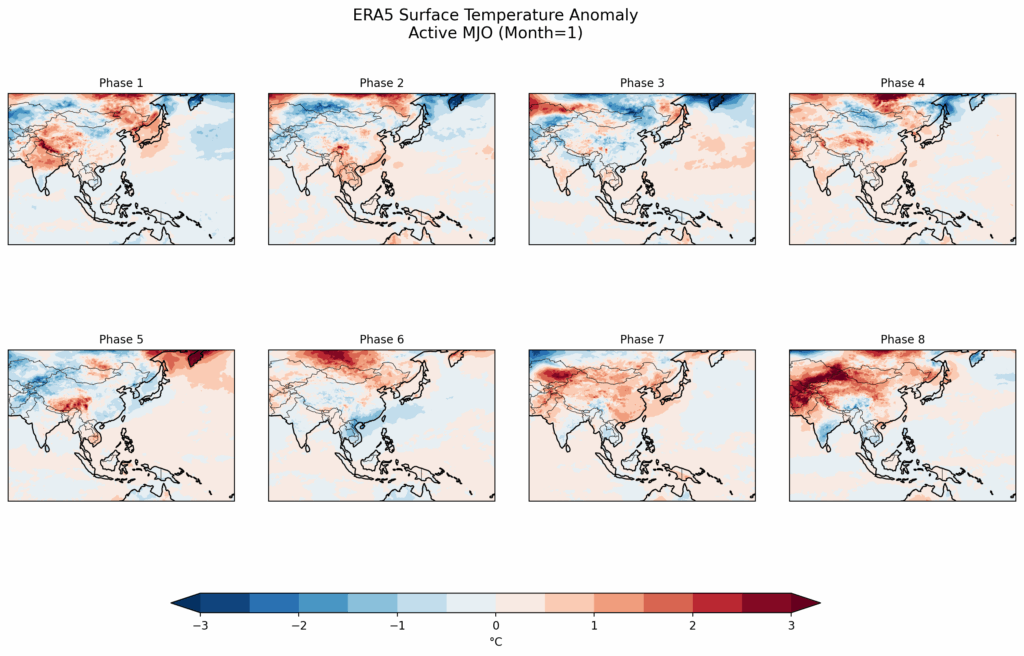
In addition, the MJO is forecast to strengthen in Phase 6 over the western Pacific during the next two weeks, a phase that often brings colder conditions to western Japan.
From the Arctic side, the Arctic Oscillation (AO) is forecast to turn negative after January 8. Ensemble guidance also leans negative, suggesting Arctic cold air can more easily move south into mid-latitudes.
However, the key question is how much of that cold reaches Japan. Looking at 500mb height anomalies through Day 15, most model scenarios show positive anomalies over Japan, indicating relatively stable conditions. Only a small number of clusters, mainly from the GEM model, show strong cold anomalies over East Asia.

As a result, the main scenario is that Japan experiences frequent but short-lived cold spells, while overall temperatures remain near normal or slightly above normal through the 15-day period.
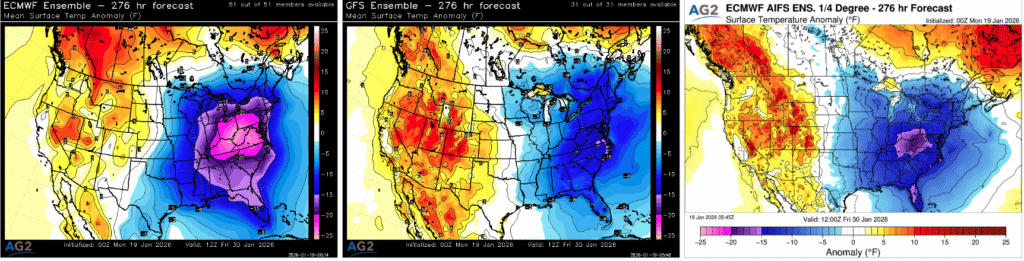
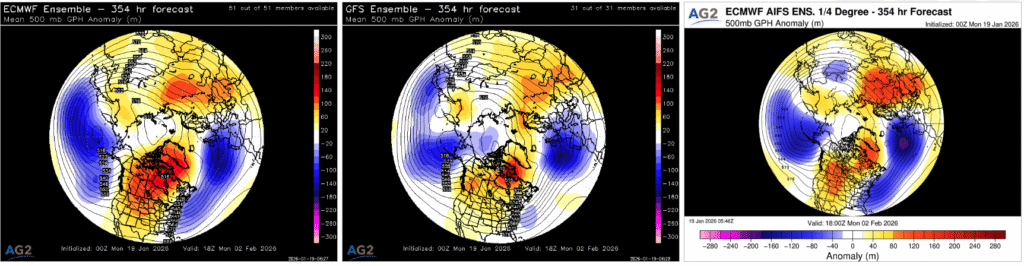
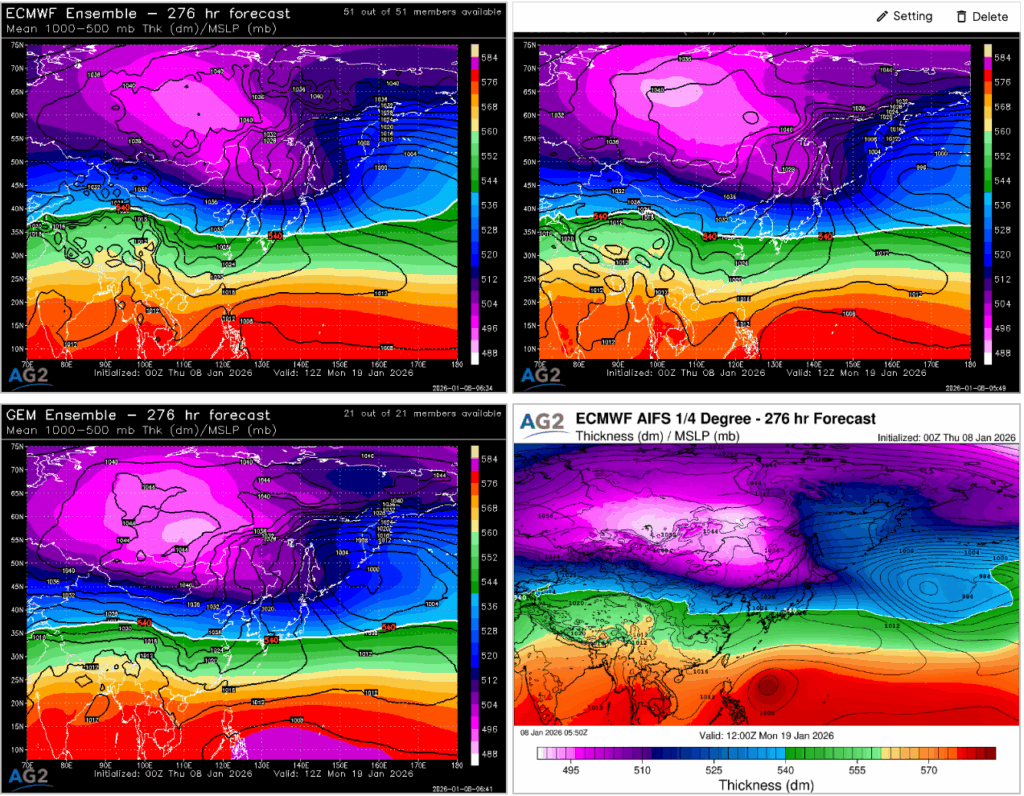
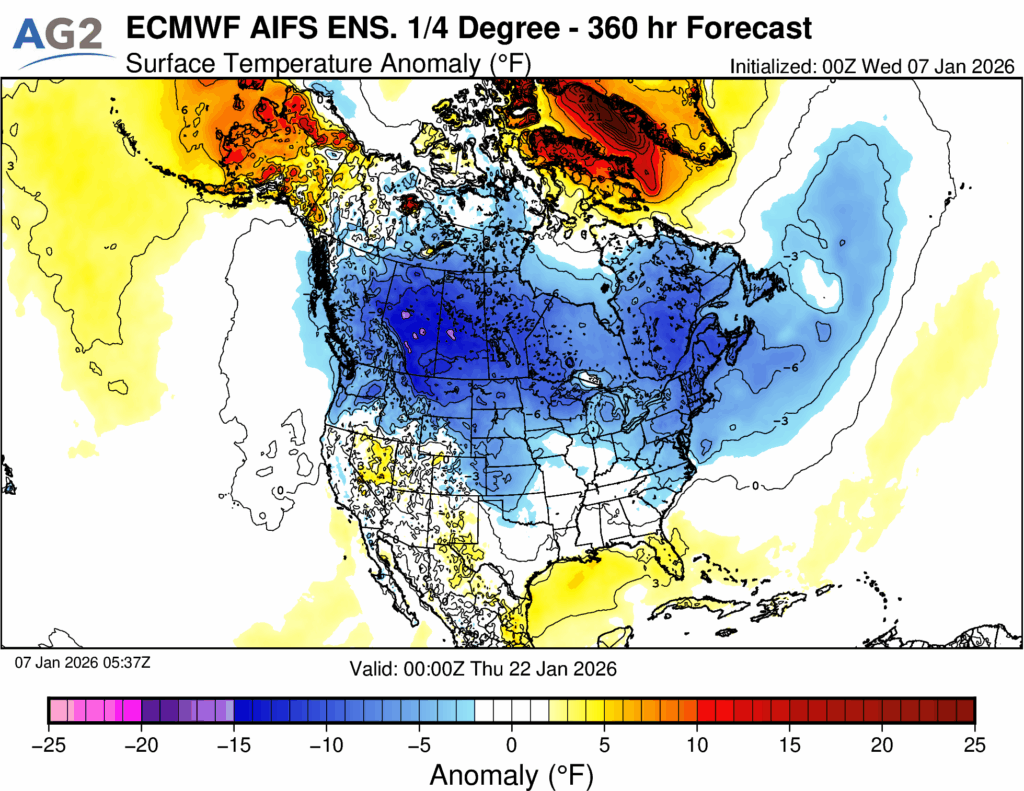
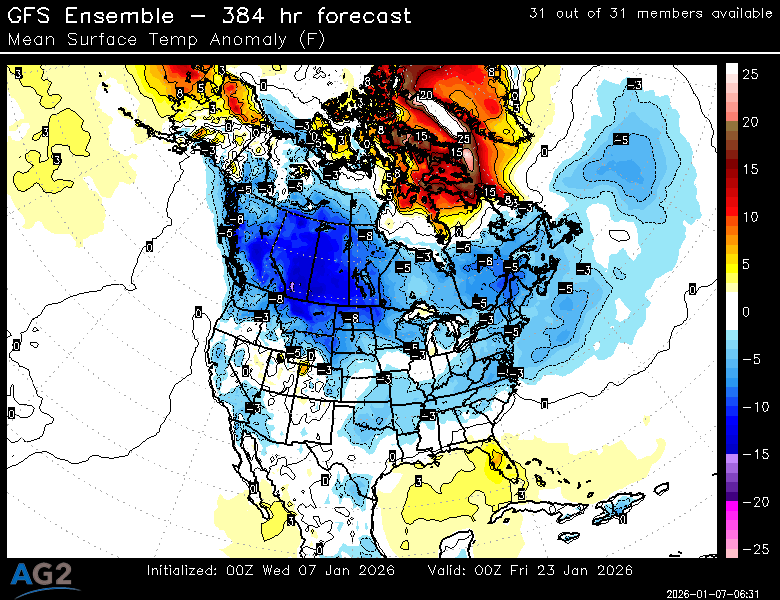
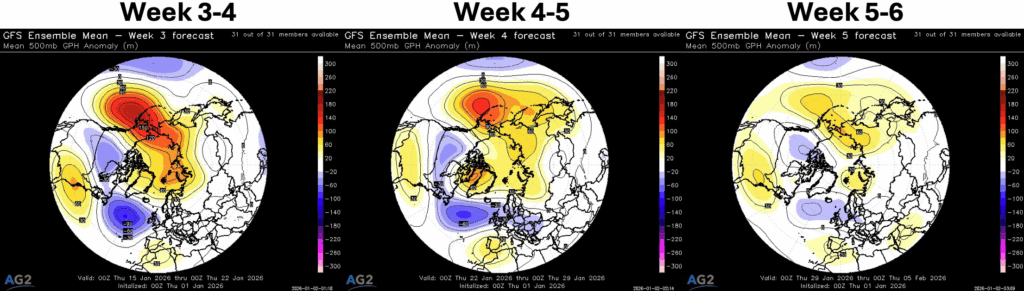
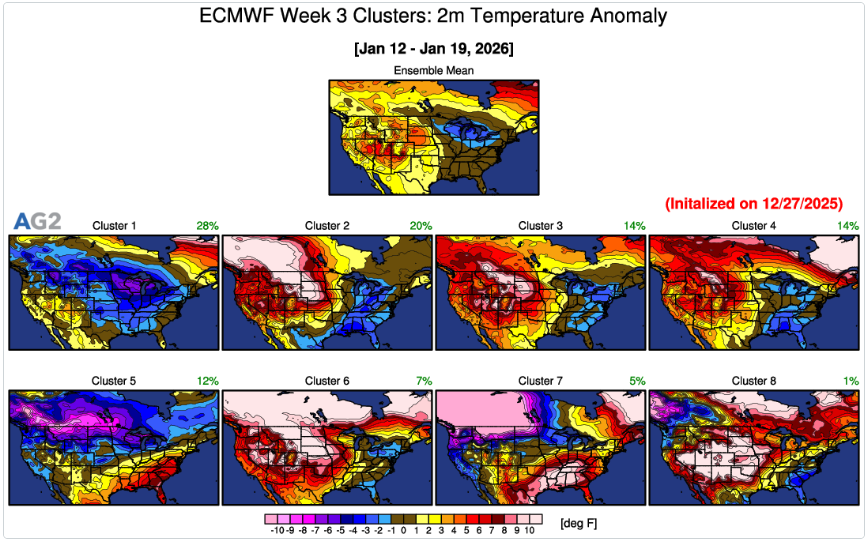
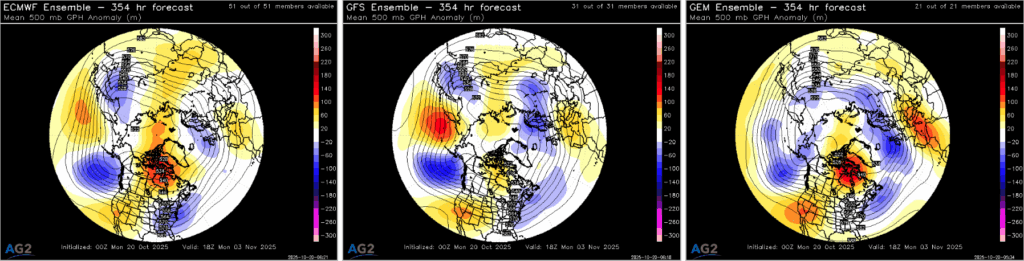
On day 15, the GFS ensemble mean, ECMWF ensemble mean, and ECMWF AIFS ensemble are all telling a very similar large-scale story at the 500 mb level, centered on a high-latitude blocking regime that favors a colder-than-normal North American background state. Each guidance set depicts a ridge building into Alaska, consistent with a negative EPO, which forces the jet stream to buckle downstream and supports colder air delivery into western and central portions of North America. At the same time, ridging extending across the high Arctic reflects a negative AO signal, reinforcing suppression of the polar vortex and allowing cold air to more readily dislodge southward.
Downstream, all three ensemble systems also indicate a ridge near or over Greenland, aligning with a negative NAO. This Greenland blocking helps slow the overall pattern and encourages troughing across eastern North America. The agreement on this triad of teleconnections (–EPO, –AO, –NAO) is notable at this lead time and lends confidence to the idea that the hemispheric pattern is supportive of sustained cold risks rather than transient shots.
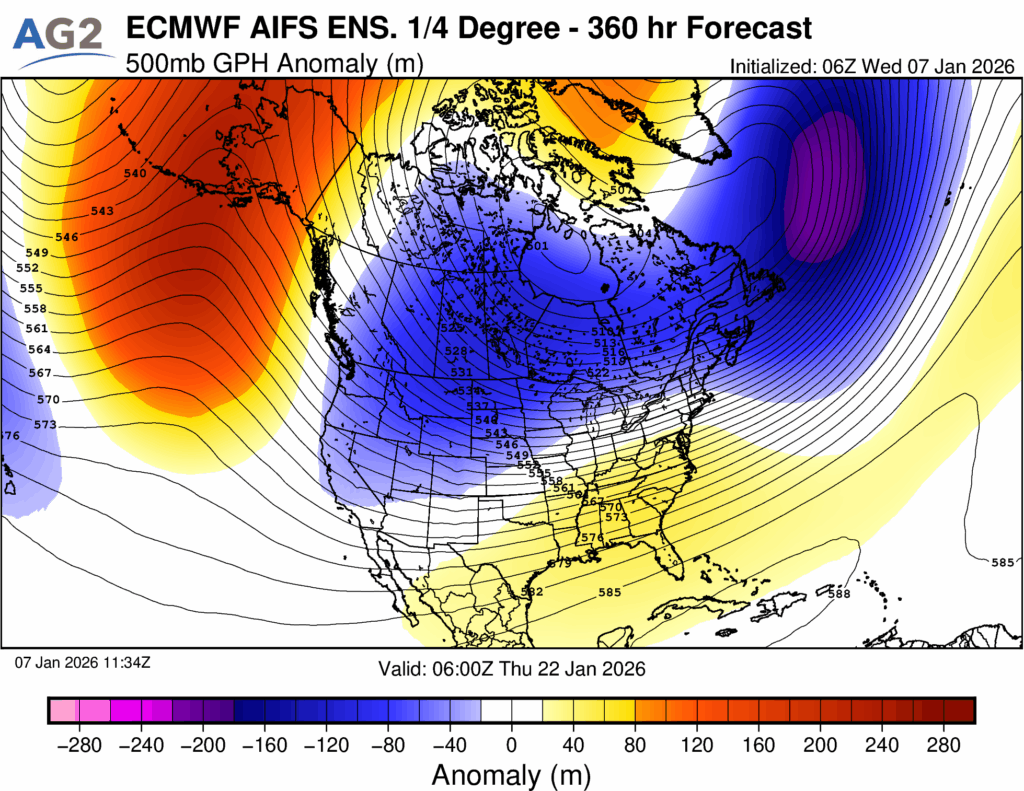
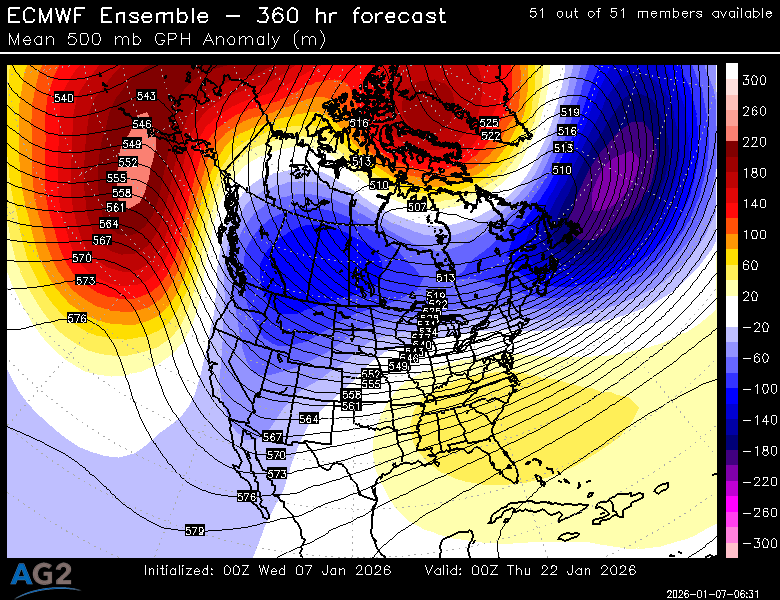
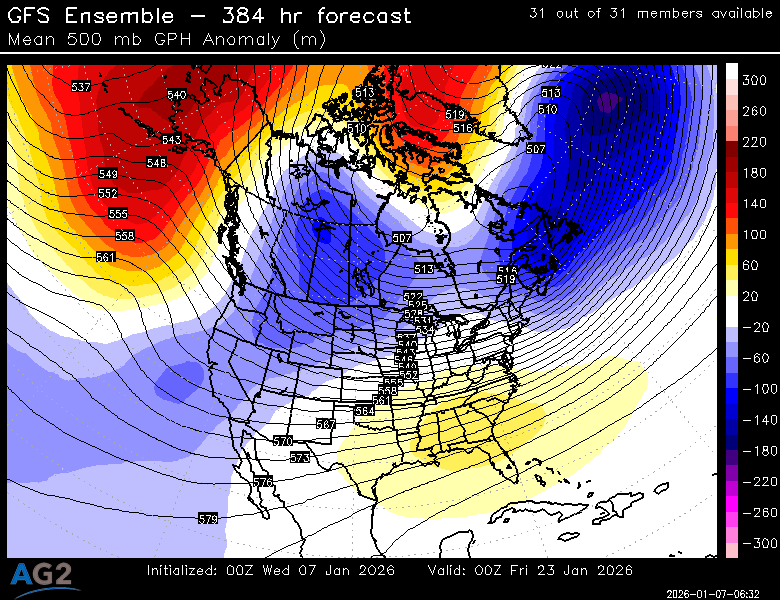
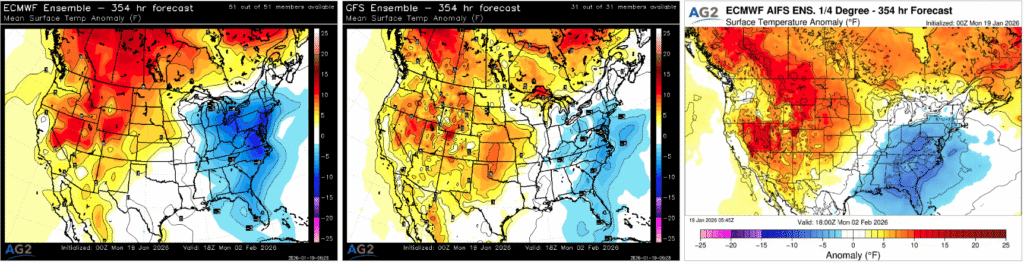
Across the CONUS, the ensembles consistently show a positively tilted trough extending from the Pacific Northwest into the west-central United States. This orientation favors a broad cyclonic flow and continued access to colder air masses from western Canada into the Plains. Downstream of this trough, a Southeast ridge is evident, particularly in the ECMWF-based guidance, which acts as a partial brake on how far south and east the cold can penetrate at the surface.
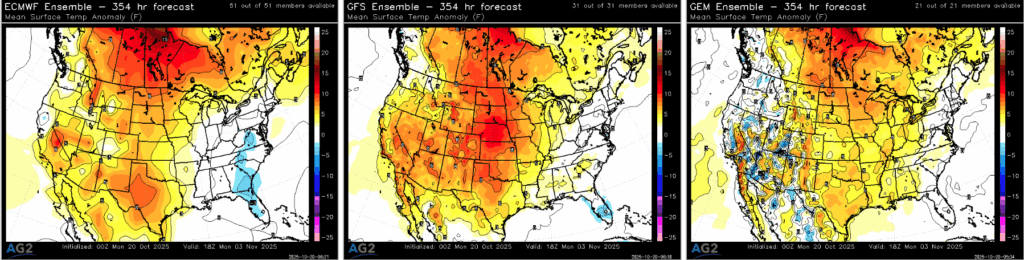
Even with that Southeast ridging, the 500 mb pattern still supports the potential for colder air to push into the Mid-Continent and possibly as far south as Texas, especially if shortwave timing or surface pressure placement becomes more favorable. While the ensemble mean surface temperature anomalies currently show limited cold signal into Texas, the upper-level configuration suggests this is a credible forecast risk rather than noise. In other words, the mid-level pattern is colder than what the surface anomalies alone might imply, leaving room for colder outcomes should the blocking and trough alignment verify more aggressively.

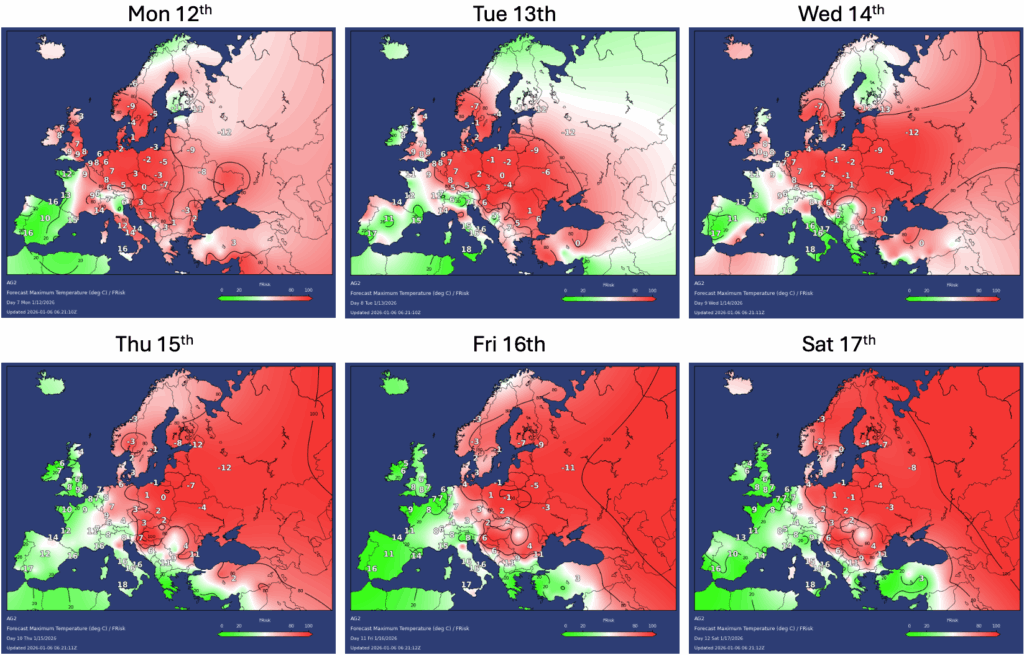
This morning, we saw some significant colder moves in the latest 00z ECMWF ENS for next week. There is now lower confidence in the forecast next week as milder Atlantic air tries pushing in from the west, with the cold pool of air still in place across eastern Europe. Here we take a look at the details of this.
The population weighted temperature graph for Central Europe below shows the significant colder moves in the latest 00z ECMWF ENS. While the latest AG2 forecast lies closer to the 00z GFS ENS.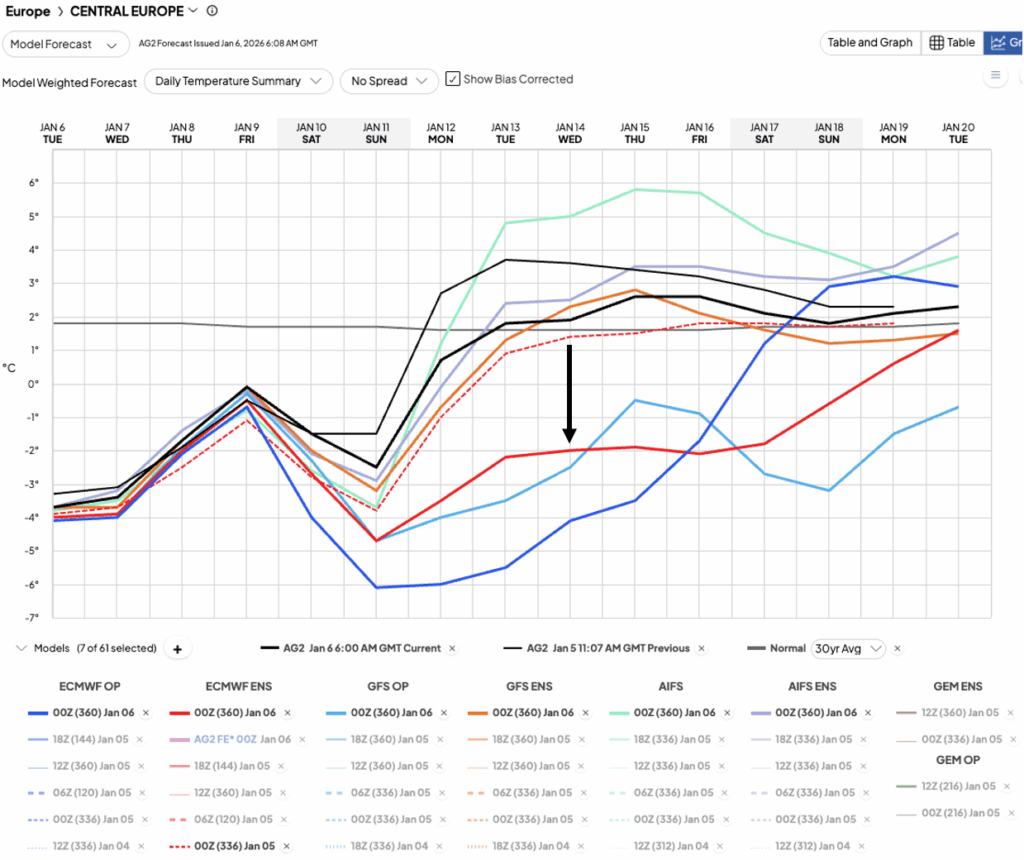
The large model spread and uncertainties next week are related to the models struggling in how intrusive milder air from the Atlantic will push in across Europe – a battle ground between a milder west and colder east, with Central Europe on the borderline between the two. FRisk graphics below clearly show that the lowest forecast risk (highest confidence indicated by green shading) next week is across the far west of Europe. While the highest forecast risk (red shading) and where we should expect forecast changes being across central and eastern Europe:
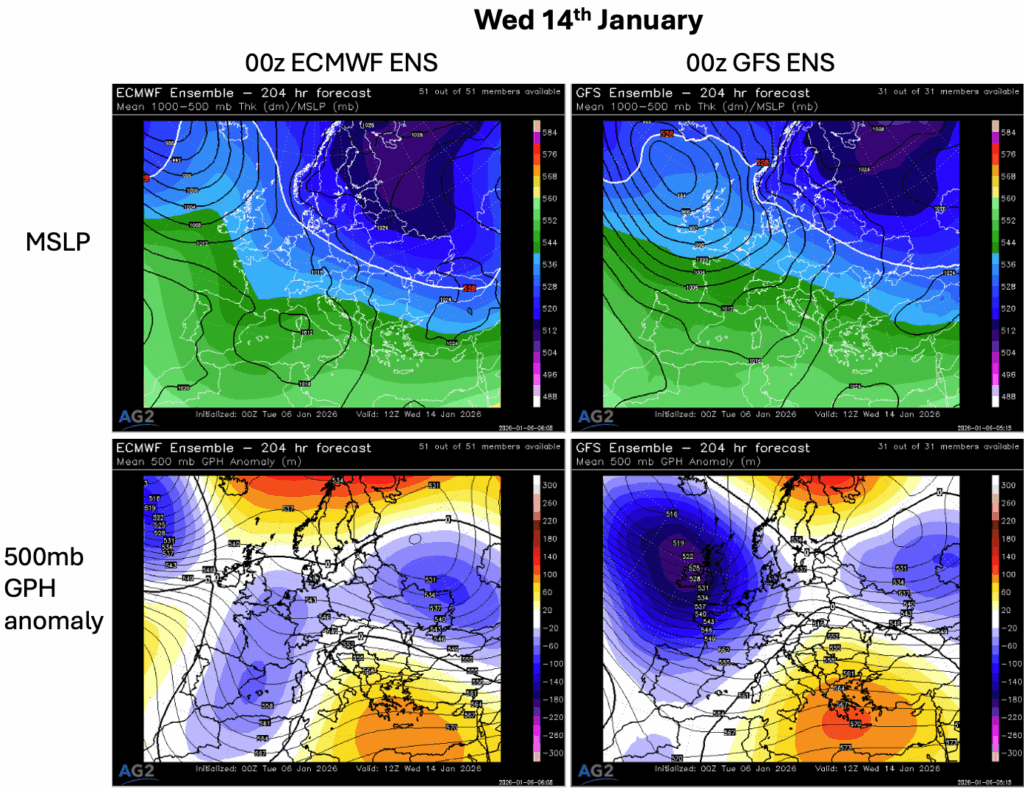
When we compare the latest 00z ECMWF ENS and 00z GFS ENS for next Wednesday, 14th January below we can clearly see the pressure pattern differences. With the GFS ENS bringing in deeper troughing the the north-west, this results in a stronger westerly airflow and hence milder air pushes further into Europe from the Atlantic causing temperatures to recover. Whereas the 00z ECMWF ENS forecasts a much weaker pressure pattern and hence the colder air holds on for longer due to a lack of a strong Atlantic airflow.
As a result, differences are also apparent in German winds next week. Alongside the colder moves in the latest 00z ECMWF ENS, associated lower wind moves for Germany:

When looking at the temperature clusters for the 6-10 day timeframe below, there are uncertainties in the exact details of that milder air pushing in from the west as discussed earlier. The top ECMWF cluster 41% is clearly the coldest solution holding onto the cold widely across northern, central and eastern Europe.

Bottom line: There have been significant colder moves in the latest 00z ECMWF ENS next week due to uncertainties in the extent of milder air from the Atlantic moving in across Europe. Confidence has therefore dropped in the forecast next week in the battleground between milder air trying to move in from the Atlantic, and the colder pool of air across eastern Europe. Alongside the colder moves in the latest 00z ECMWF ENS, German winds have also dropped lower. FRisk graphics show the highest risks next week are across central and eastern Europe, so we should expect forecast changes here. While to the far west, there is lower forecast risk, or higher confidence here. The latest AG2 forecast currently lies closer to the 00z GFS ENS which begins to recover temperatures closer to the seasonal normal next week. Overall, a low confidence forecast now next week, with a moderate risk from the 00z ECMWF ENS that temperatures could remain lower for longer.
Sub-seasonal guidance keeps on pointing at a milder recovery later in January, linked to enhance Atlantic influence. This should favor wetter and windier conditions into NW Europe under troughing, but there is higher uncertainty on the extent of such into C Europe. Larger scale drivers provide weaker signals limiting somewhat forecast confidence late Jan into Feb right now.
Looking at the latest EC weekly run, we find an overall milder forecast than its previous release, especially in weeks 3 and 5. Only slightly milder and more towards the NE W4, while slightly cooler across C Europe W6 eventually.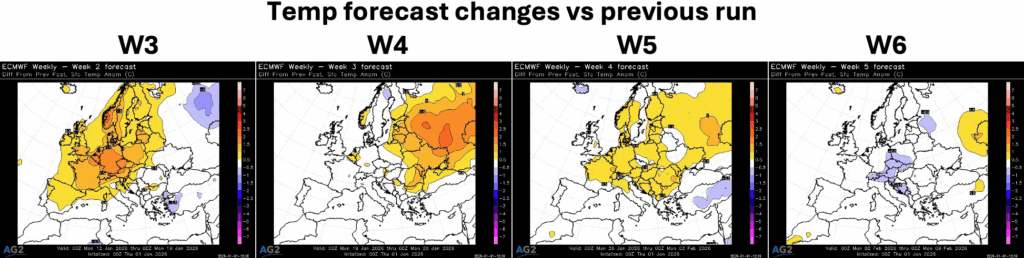
Let us get into a weekly breakdown of the latest solution, with regards to pattern, temps, renewables for Europe and what we think of those from the ensemble mean solution standpoint.
Calendar Week 4
- Pattern: Higher pressure is resolved through SW and NE areas of the continent, with deeper troughing NW, connecting through the C Med through shallower low heights.
- Temperatures: Widely milder than normal, if not nearer normal across C-E mainland Europe.
- Hydro: Very week signal, leaning somewhat wetter NW and into the Med, while drier far SW.
- Wind: Above normal C-W Europe, nearer normal E’wards.
- Solar: Overall cloudier than normal, except for slightly sunnier S Europe locally.
- Confidence/Risk: Expectations of milder weather are fair, with GFS weekly and main MJO wave supporting NW troughing, but the outburst of tropical convection over the Atlantic next week could have some repercussions in liming the warmth. Also, high uncertainty in the extent of troughing into C Europe based on poor clustering on that. Finally, not a fan of the weak precipitation signal – general shape is fine based on pressure pattern, but I would like to see more pronounced anomalies.
Calendar Week 5
- Pattern: Troughing to the NW extends into W Europe, while ridging from the NE protects E Europe more.
- Temperatures: Falling not too far from seasonal, but with a milder lean W a colder skew E. More pronounce warm anomalies are resolved to the NE and far SE peripheries of the continent.
- Hydro: Very week signal, but we can argue a slight wetter skew W and S, while drier NE.
- Wind: higher than normal NW, with lower the further S and E we move.
- Solar: Sunnier leaning signal, with cloudier conditions focused through Scandi and in some areas of the SE.
- Confidence/Risk: Decent confidence in main area of troughing staying NW, which limits any colder risks. The latter may however come from a weaker vortex. MJO signal is very week and washed-out by then and hard to hold on to it for any clearer guidance. Lower confidence on precipitation and solar, with the risk of wetter/cloudier W-SW and drier/sunnier NE-E.

Calendar Week 6
- Pattern: Similar pattern as to what resolved for calendar week 4 above, over and around Europe.
- Temperatures: Skewed milder away from slightly colder C-E Europe.
- Hydro: Wetter signal SE, drier SW.
- Wind: Windier than normal NW, calmer through Iberia and E Europe.
- Solar: Sunnier W, cloudier E.
- Confidence/Risk: GFS weekly supports the idea that NW troughing sticks around, but EC46 clustering shows more volatility, suggesting lower confidence. Any colder, more blocked pattern could be aided by a weaker polar vortex, while little guidance can be found in the MJO forecast.

Calendar Week 7
- Pattern: NW troughing with higher heights S and E of it.
- Temperatures: Widely milder than normal.
- Hydro: Slightly wetter signal NW and drier SW, fairly coherent with the +NAO kind of look.
- Wind: Windier than normal NW, with lower wind further S and E.
- Solar: Weak, patchy signal.
- Confidence/Risk: Limited confidence on the persistency of NW troughing. Any colder risks could come from MJO (possibly increasing variability, yet not too clear at the minute), and/or a weaker polar vortex. Drier/sunnier risk through the mainland, especially S and E than currently resolved based on the pressure pattern alone.
GFS weekly
The latest GFS weekly aligns with the idea of lower pressure being to the NW of Europe, supporting less cold/milder expectations mid-late January. Only issue here is the rather stagnant pattern resolved throughout the GFS weekly solution – not necessarily too convincing.
Polar vortex
The latest stratospheric polar vortex forecast shows a slightly weaker than normal vortex Mid-late Jan, shifting slightly stronger into Feb. There continues to be a large spread on both sides of the mean, with a handful of members continuing to drop into SSW territory late Jan into Feb. All of this makes for a very open forecast still with regards to the potential stratospheric influence on lower levels in particular.
MJO
The active MJO phase over the Maritime continent into the W Pac supports the recovery from more -ve NAO conditions next week, with the interference from tropical convection in the Atlantic limiting the rise of the NAO index towards mid-month. Further out though, we find a weak and washed-out MJO signal, providing limited guidance and little to hold on to in terms of forcing on the NAO and hence European weather just yet.

Bottom line: Sub-seasonal guidance continues to offer a milder picture through the back half of January with the development of lower pressure NW Europe, stimulating Atlantic flows. Wetter/windier conditions favored through NW Europe there, but with some uncertainty on their penetration into C Europe. Some risks of colder, or more variable patterns there and into Feb could come from larger scale drivers like MJO and SPV, but their extended-range forecast is highly uncertain at the minute, limiting forecast guidance. Milder end of Jan and Feb align well with broader seasonal expectations though.
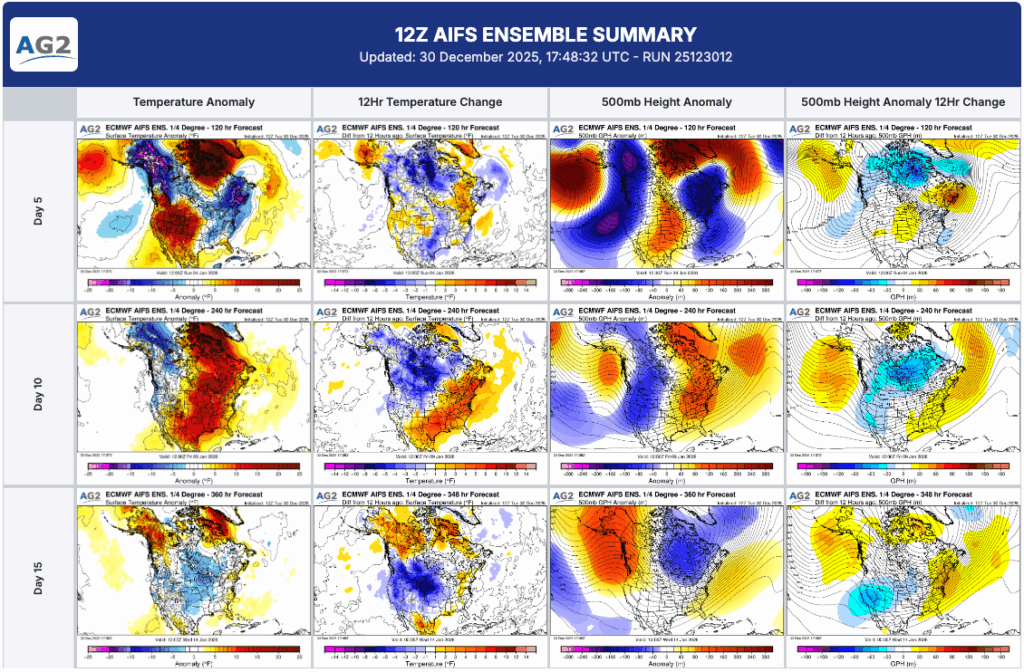
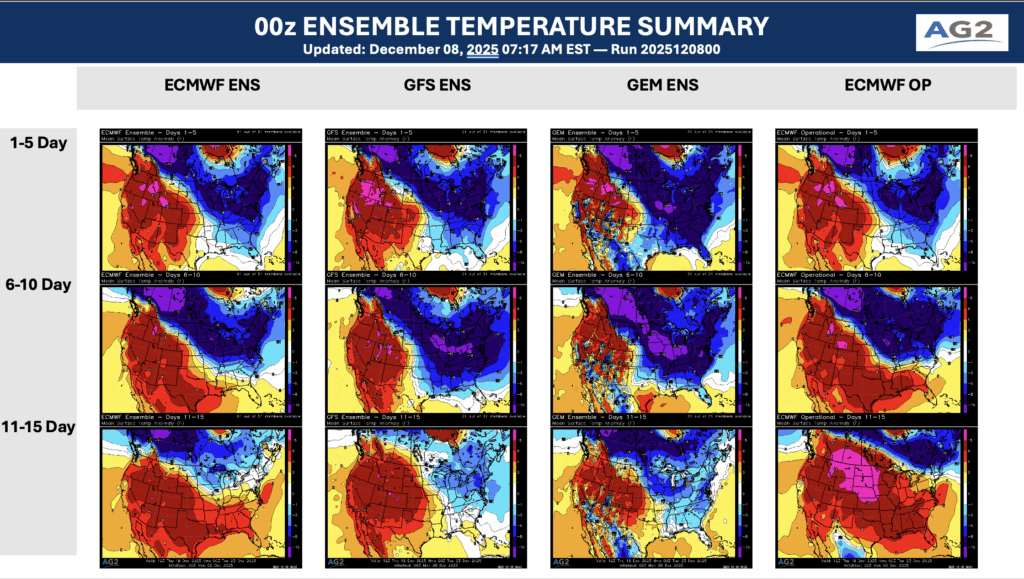
Based on the forecast image, the signal for a cold January in the U.S. is strongly tied to persistent Alaska ridging and a negative EPO look in the mid- to long-range. The 500 mb height anomaly panels show pronounced positive height anomalies centered over Alaska with corresponding negative height anomalies downstream across central and eastern North America, a classic configuration for sustained Arctic air delivery. This pattern forces the jet stream to dive south out of western Canada, allowing cold air to drain repeatedly into the Plains, Midwest, and East. The temperature anomaly and 12-hour change panels reinforce this setup, showing expanding below-normal temperatures spreading south and east with limited Pacific moderation. As the Alaska ridge remains anchored through Days 10–15, the cold source region stays replenished, increasing the likelihood of prolonged cold rather than brief shots. In January, this type of EPO-driven Alaska blocking pattern is especially effective at producing widespread, intense cold across much of the United States. Confidence is rising as models are coming into better agreement on mid-Jan cold outbreak.
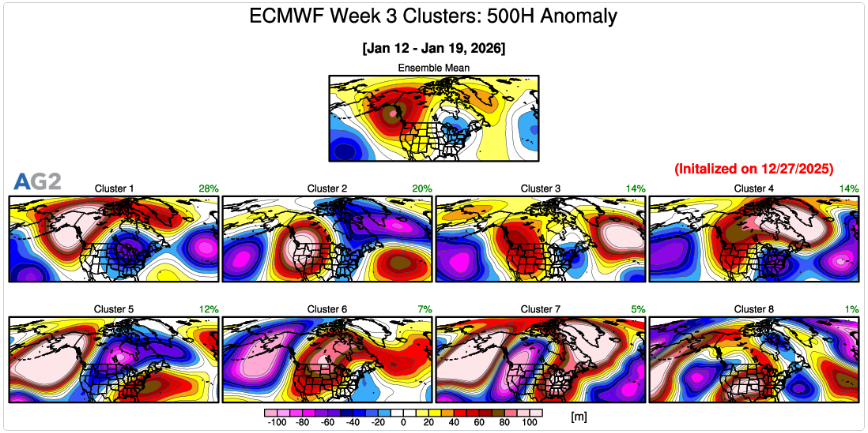
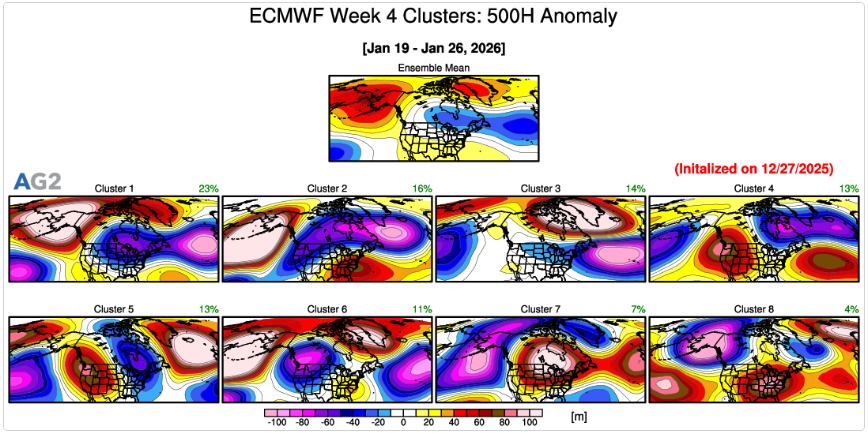
ECMWF Weeklies: Mid-January Pattern Evolution at 500 mb: The ECMWF weeklies signal a notable hemispheric shift as we move into mid-January, highlighted by strengthening ridging over Alaska and the higher latitudes of the North Pacific. Note the major change from Week 2 to Week 3 timeframe as the ensemble clusters increasingly favor positive 500-mb height anomalies centered over Alaska, with downstream troughing becoming more prominent across central and eastern North America. This configuration is a classic high-latitude blocking look, promoting cross-polar or Arctic air delivery into the CONUS. By Week 4, while cluster spread increases (as expected at longer leads), the persistence of Alaskan ridging in a meaningful portion of the solutions supports an elevated cold risk for the U.S., particularly east of the Rockies. The overall evolution points toward a more amplified flow regime, with reduced Pacific moderation and a greater likelihood of sustained cold intrusions rather than brief, transient shots.
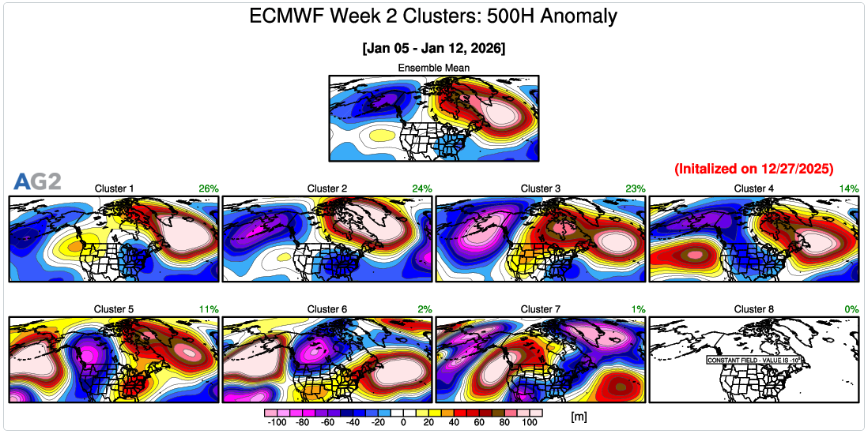
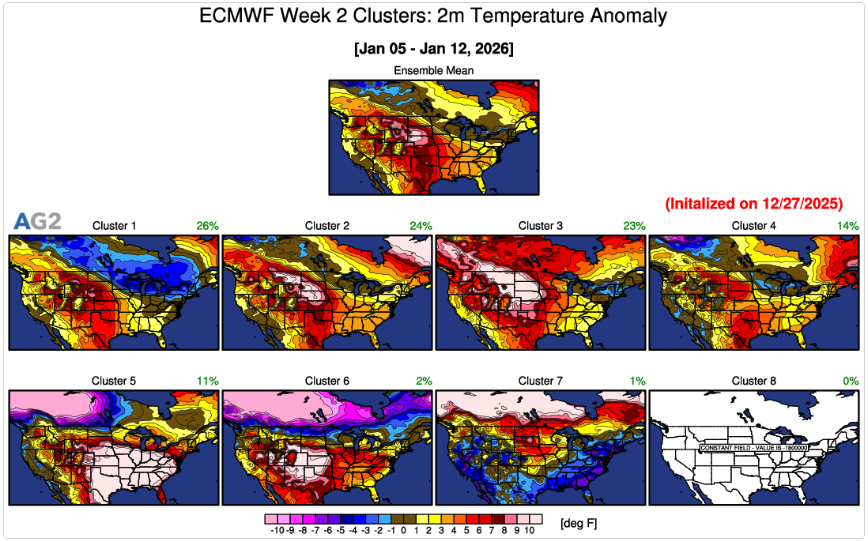
Surface Temperature Anomaly Evolution: At the surface, the temperature anomaly clusters evolve in a way that coherently reflects the upper-air pattern. During Week 2, warmth dominates much of the central and eastern U.S., consistent with still-limited high-latitude blocking and a relatively progressive flow. As the Alaskan ridge strengthens into Week 3, colder anomalies begin expanding southward from Canada, especially across the northern Plains, Midwest, and eventually the East, while warmth becomes increasingly confined to the southern tier and parts of the West. By Week 4, several clusters depict widespread below-normal temperatures across large portions of the U.S., signaling a higher probability of a colder-than-average regime becoming established. While not every solution is uniformly cold, the trend toward broader negative temperature anomalies aligns well with the growing influence of high-latitude blocking and reinforces the idea that mid- to late-January carries an increased risk for impactful cold across the CONUS.

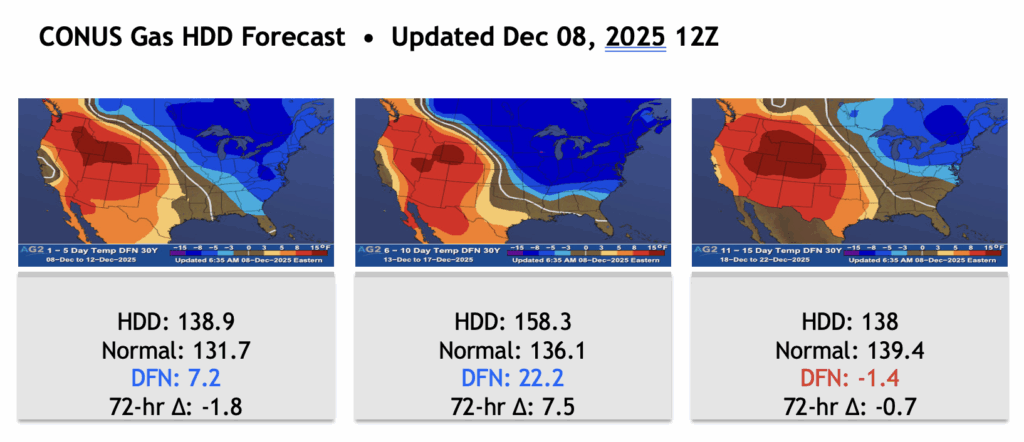
The 12 day national demand change since Friday is +5.0 HDDs…
Modeled temperature anomalies for the next 15 days are below. Cold peaks in the next 5-7 days in the Midwest and Northeast with multiple 30+ HDD days expected. The 11-15 day offers a contraction of the cold into the Northeast, allowing the south and MidCon to warm up, but the Midwest and Northeast still look quite cold.
Texas really does not get into this extreme cold, with all models agreeing the worst is north and east of there for the most part through the 15 day period…
Our period maps are below noting mixed changes through the 15 day period versus Friday, highlighted by the 6-10 day trending colder.
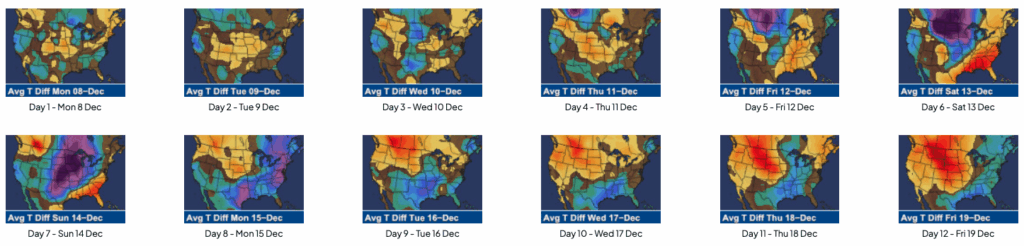
Changes since Friday, by day, are below for the next 12 days.
HDDs remain above the 30 year normal through the next 10 days except for around Dec 10. Modeling trended warmer in the 11-15 day since Friday – also note we are colder than all models in the 11-15 day, partially due to AI guidance being colder currently.
A lot of these HDDs are driven by the Chicago->NYC corridor being as cold as it looks to be in these locations.
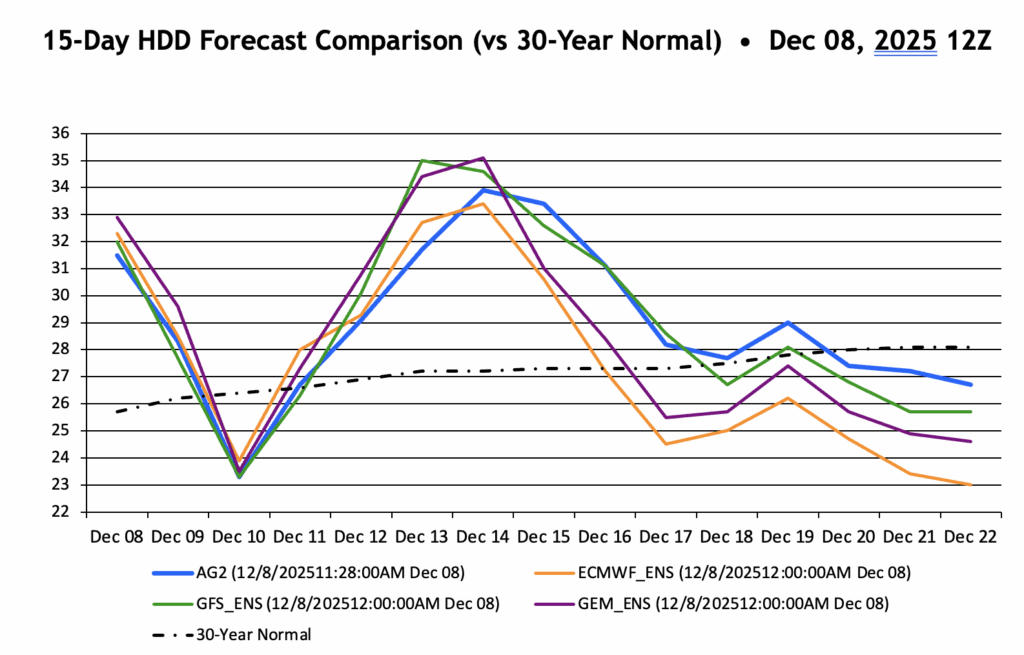


Looking at day 15, December 22nd, there remains colder risk in the Northeast, but most of the CONUS is warming up. The cold source remaining in western Canada is also getting scoured out. With ridging vacating AK, we may be entering the “rebound” portion of this pattern evolution, with warmer temperatures returning to the MidCon.
Our DEC HDD number is up to 891.5 HDDs – a fair envelope is 870-910 HDDs (30 year normal 840, 10 year normal 771).

Below we can see the expected VP200 forecast from the ECMWF and GFS weekly models. Notice both have a fast moving area of upward moving circumnavigating the globe currently, then again between 5-15 December. This promotes changeable conditions, but coupled with an active MJO and the recent stratospheric activity, there certainly is evidence for this colder pattern to linger into the 16-30 day.

The end of the 15 day forecast, around December 15th, is right in between these two CCKWs – the result is a “slightly” milder start to the week of the 15th as a ridge tries to build in the Southern Tier.
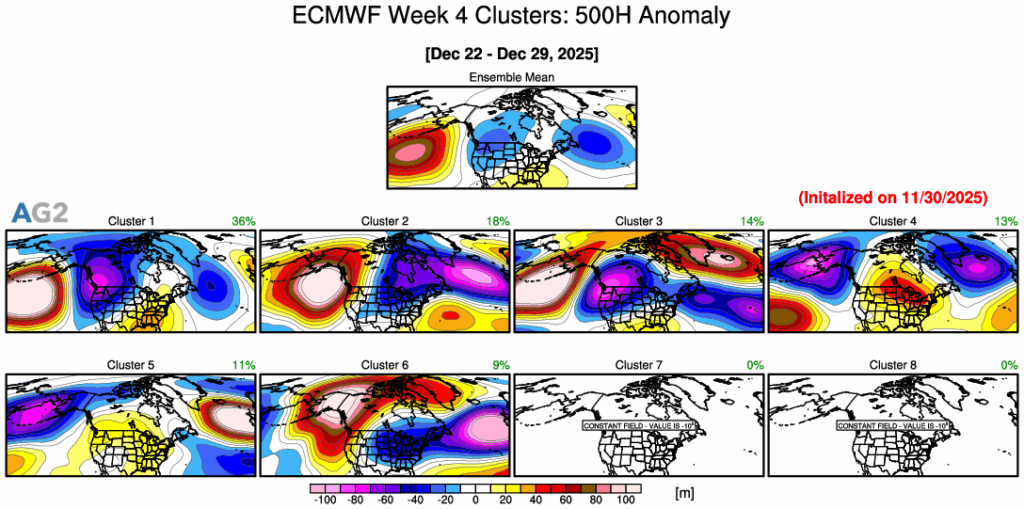
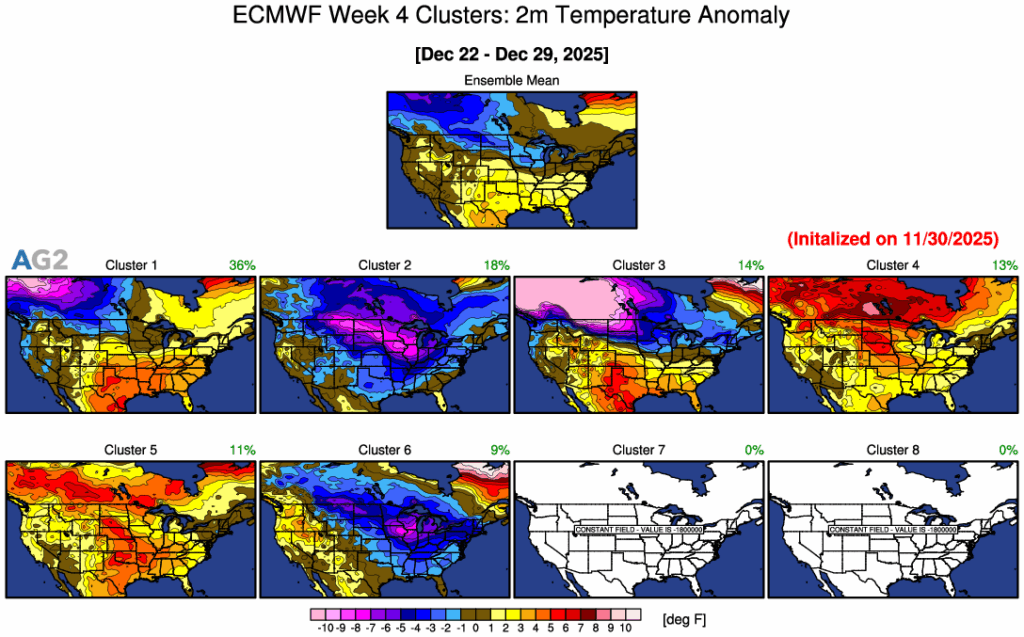
However, if the CCKW forecasts above are to be believed, there may be more choppiness into the week of the 22nd, versus a straight up warming trend. The ECMWF weekly clusters for Dec 22-29 are certainly mixed – plenty of bullish solutions, but the top cluster (36%) is much warmer in the East.
Bottom line: the MJO and fast moving CCKW’s are making us think the colder pattern we are enduring may linger deeper into December, with day to day variations of course expected…
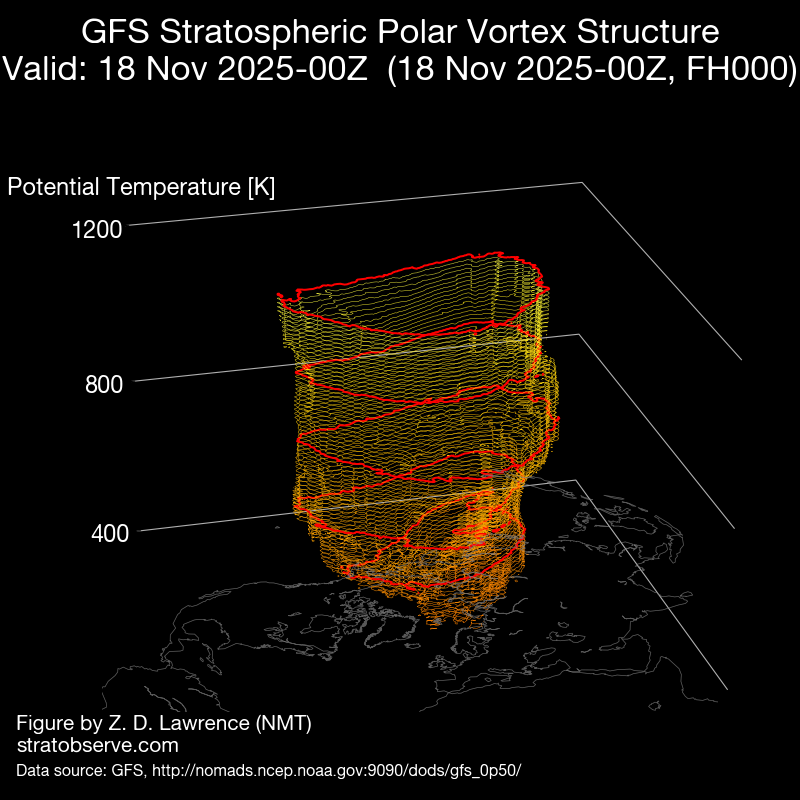
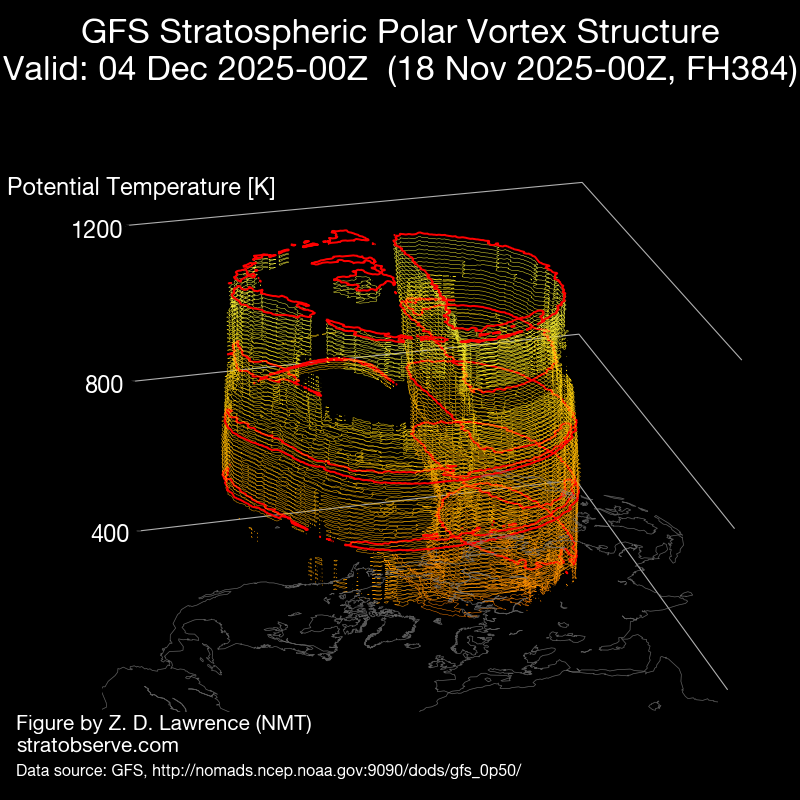
These two GFS 3-D forecasts suggest a meaningful weakening and distortion of the stratospheric polar vortex heading into early winter, which can carry important implications for mid-latitude weather. The first image, valid 18 November 2025, shows a fairly coherent, vertically aligned vortex structure that matches what is usually seen during a stable early-winter polar night jet. By the second image, valid 4 December 2025, the vortex becomes much more elongated, fractured, and vertically disrupted, with clear splitting tendencies and signs of stronger wave activity pushing into the stratosphere. Such deformation often precedes further weakening or even a mid-winter warming event, and if this trend were to continue, it would raise the odds of a negative Arctic Oscillation pattern later in the season, which is typically linked to colder, more disrupted winter weather in the mid-latitudes.
Temperatures across much of East Asia are expected to remain below normal through November 20. Along the Sea of Japan side of Japan, some low-elevation areas may see their first snowfall in the coming three days.
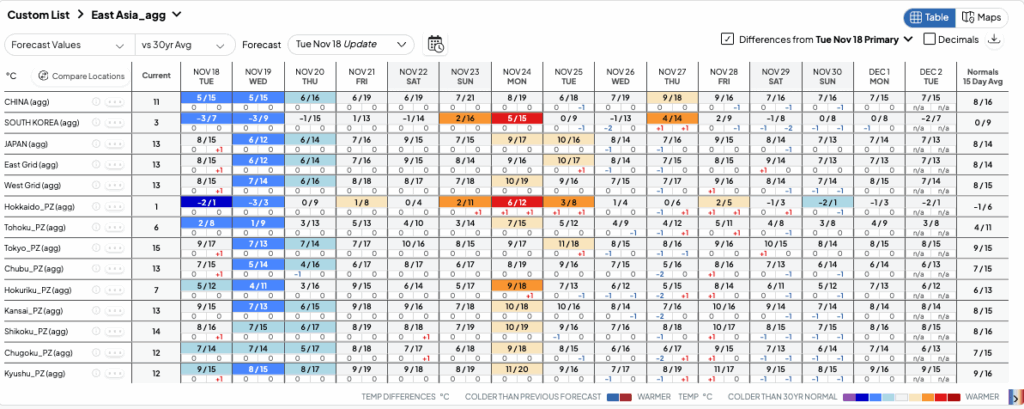
From the 21st onward, most forecasts indicate near- to slightly-above-normal temperatures, and model agreement remains high through November 24.
However, after November 25, model spread increases sharply, and FRisk highlights a significant temperature fluctuation risk.
Day 11–15 500mb GPH anomalies show substantial uncertainty in the position and depth of ridges and troughs.

Warm colors indicate ridges (anticyclonic), and cool colors indicate troughs (cyclonic). Cold-air outbreaks typically occur west of a trough or east of a ridge.
ECMWF and GEM place the trough axis broadly from northern China to Japan, while GFS exhibits much greater ensemble spread, underscoring higher uncertainty.
Thus, China, Korea, and Japan are likely to shift toward colder revisions during this period.
The latest ECMWF AIFS further suggests that a trough may stall from northern China to Japan between Nov 29 and early December, likely due to a blocking ridge near the Aleutians.
This scenario raises the potential for a prolonged cold spell beginning around Nov 29, with implications for heating demand and energy markets.
Stratospheric Sudden Warming (SSW) May Reinforce Cold Risks
Signals of a possible SSW event strengthen the case for late-November cold.
An SSW occurs when the stratospheric polar region warms abruptly, weakening or reversing the polar night jet. This can disrupt the tropospheric jet stream, increasing the likelihood of cold-air outbreaks in mid-latitudes.

Forecasts of 10 hPa zonal winds at 60°N show ensemble mean winds turning easterly around Nov 27, with increasing spread afterward—consistent with rising SSW uncertainty.
Stratospheric temperature anomalies at 10 hPa also show warming beginning around the same time.
Negative Arctic Oscillation (AO) Adds to the Risk
The AO index is forecast to turn negative after Nov 23, with many members remaining negative into early December.
A negative AO weakens the polar vortex and allows Arctic air to spill southward more easily, increasing the likelihood of cold outbreaks in East Asia.
In short, the period from late November into early December carries an elevated risk of a significant and potentially prolonged cold spell, with likely impacts on heating demand and energy supply balance.
This blog takes a look at the latest drought monitor, which was issued this morning, October 23rd.
The latest drought monitor is below, noting drought coverage is down to 72.12% (down from 74.04% last week).
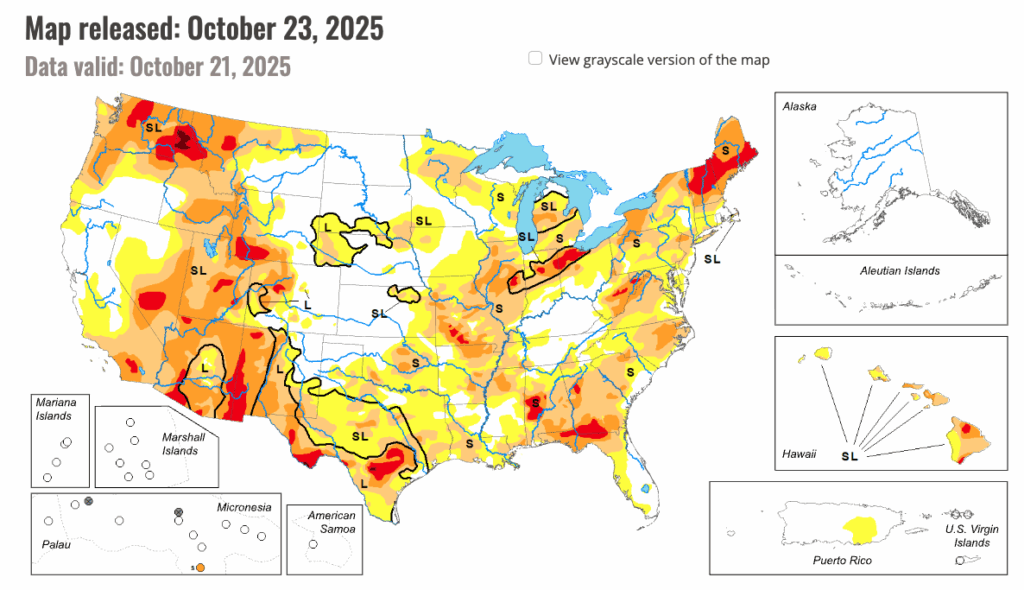
Week over week and month over month change maps are below. The most notable trends in the last month are wetter in parts of the Interior West, Rockies, and along the Ohio River, but drier in parts of Texas, the southern tier, Upper Midwest, Great Lakes, and East…

The forecast over the next 15 days is quite wet across the PNW as well as across the southern tier and along the East coast. It looks drier across much of the Upper Midwest and Southwest over the next 15 days relative to normal.

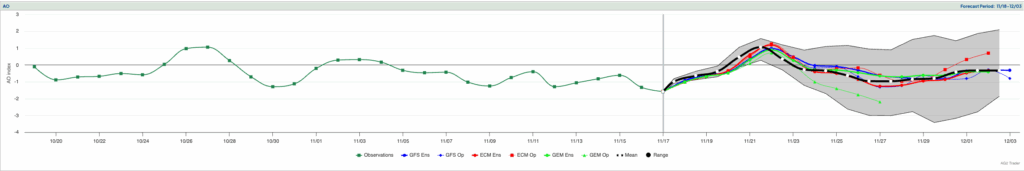
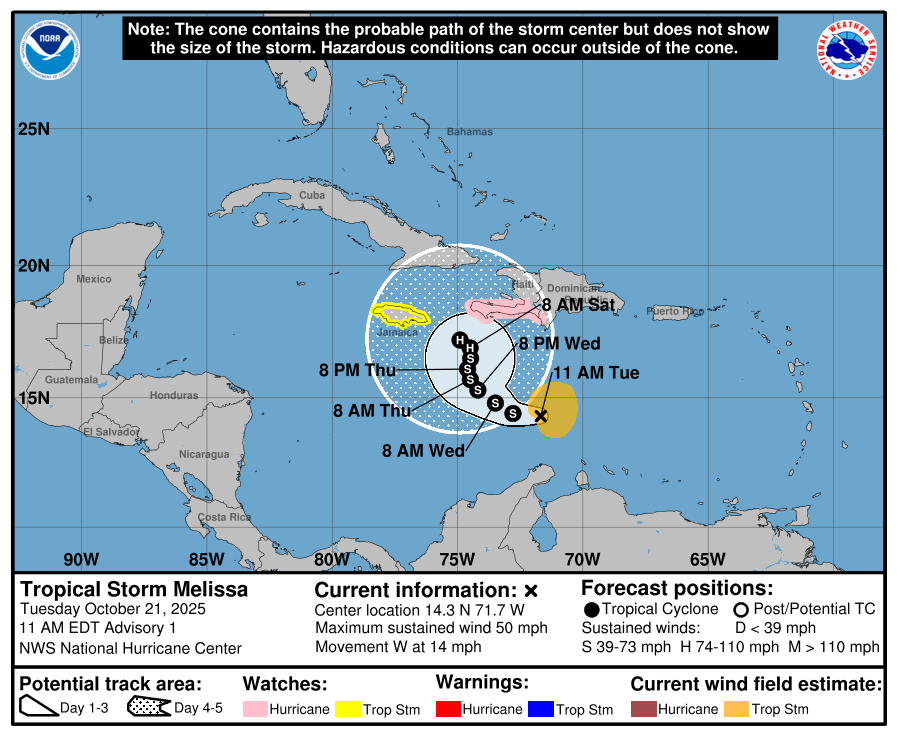
Tropical Storm Melissa formed this morning almost halfway between Aruba and Hispaniola. It will slowly meander northward and may become a hurricane by this weekend. NHC track is below.
Model solutions remain very uncertain regarding the track of this system. The GFS and ECMWF model member tracks are shown below, noting really no member gets close to the U.S. through early next week.
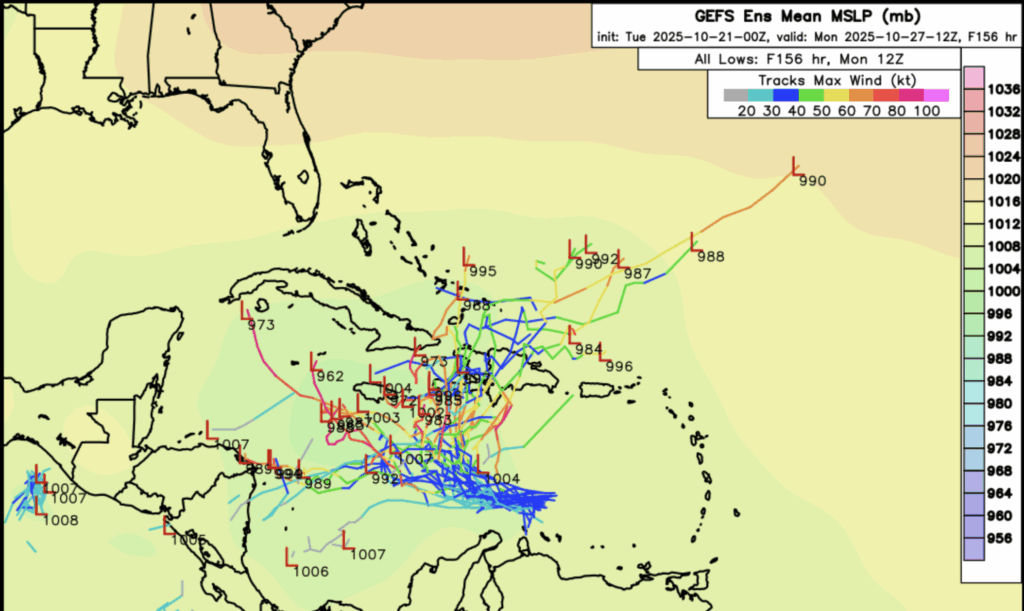

However, eventually this system will catapult northeastward in due time. Notice the same model members above now spread out the late next week show a similar idea with Mellisa ejecting northeastward over Hispaniola or Cuba, then east of the Bahamas. Florida should continue to monitor this system.

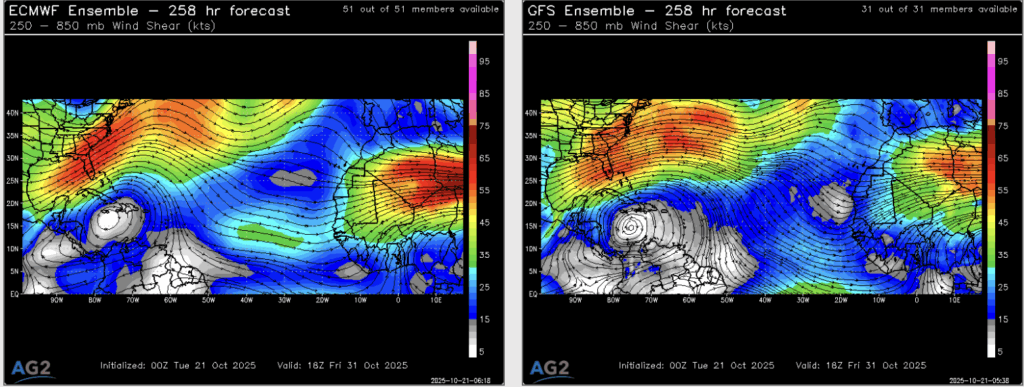
Wind shear looks very strong behind a cold front closer to the U.S., so the risk for a direct hit is low at this time. More to come…
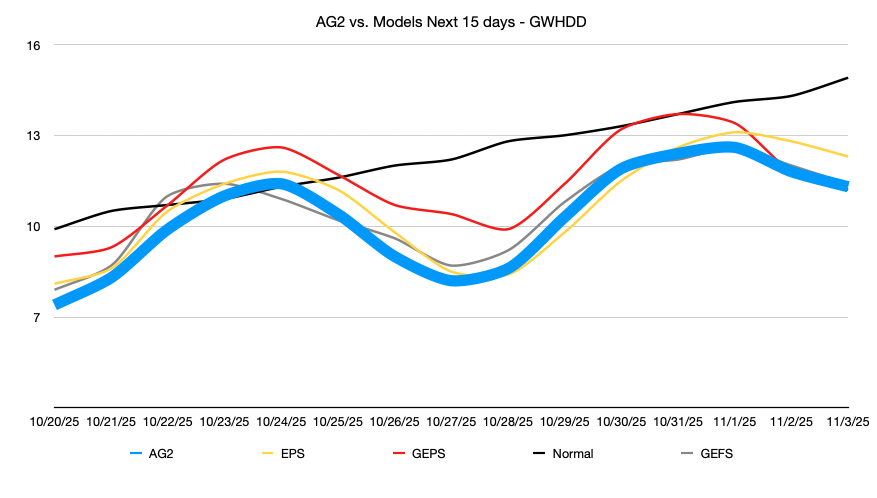
The 12 day national demand change since Friday is +9.1 HDDs…
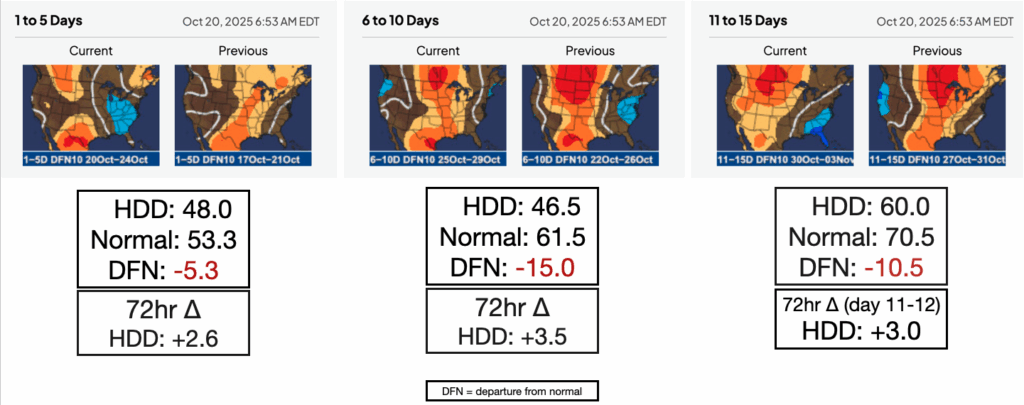
Modeled temperature anomalies for the next 15 days are below, noting some chill this week in the East, a very warm 6-10 day, and more eastern chill in the 11-15 day.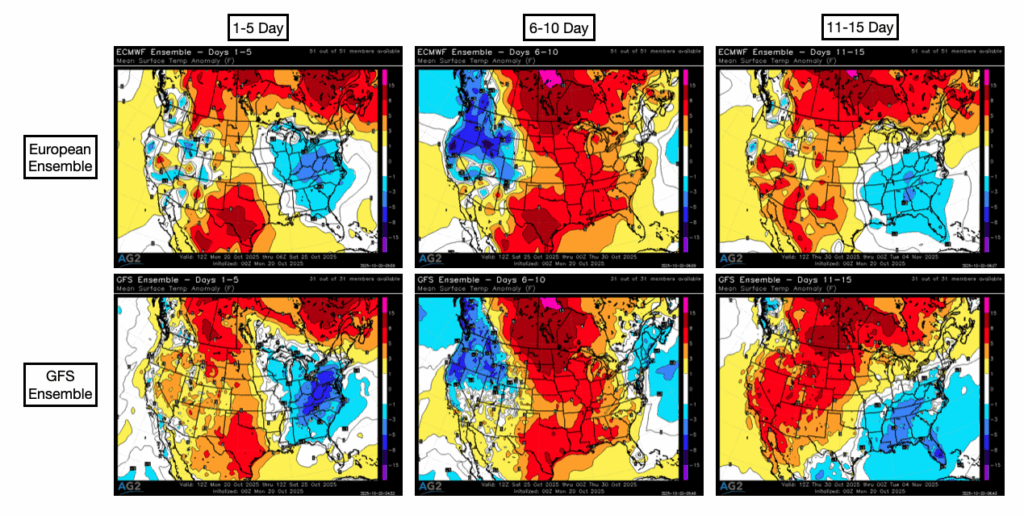
Our period maps are below noting cooler changes in all periods since Friday, especially in the East.
Changes since Friday, by day, are below for the next 12 days.

HDDs remain below normal throughout the period, despite recent cooler weekend changes. A testament to the +EPO we are experiencing…
By day 11, October 30, we see a lingering -NAO, but the N Pacific pattern has a lot of troughing (+EPO), which is still not conducive to a widespread cold outbreak. Regardless the pattern does look to cool down a bit in the East thanks to an incoming trough.
Not a lot of cold to work with in the source regions in Canada, so the risk here remains limited for anything widespread or durable in terms of cold.

By day 15, November 3, we can see that trough moving east, with ridging slowly returning to the MidCon. Notice the north Pacific is not as trough-y, but still not overly conducive to widespread early season cold…
Not a cold pattern…
Not a ton of support from the week 3 ECMWF weekly clusters for cold through that week of November 3, either, with only 22% of members truly offering something meaningful. Will continue to watch the mid-November pattern…
