Published by Andrew Pedrini
This is a Northern Hemisphere rundown for the latest ECMWF Seasonal forecast released yesterday covering August through January.
US
A hotter and drier signal is found across the Plains through the Midwest towards the East Coast and Mid-Atlantic in August, with a less hot and wetter West, in a pattern almost diametrically opposed to what has been observed so far this summer. The temperature pattern holds into September, while conditions are projected to turn wetter more widely, except for the far Southeast and Florida. Heading through fall and into winter, anomalous warmth is forecast to lift further north towards Canada, while wetter conditions progressively focus towards the coastal areas. This points to near to somewhat cooler than normal conditions developing towards winter through the southern tier of the country, among nearer normal precipitation for the central and more interior regions.


Europe
Fairly hot conditions are forecast for Europe through August, among a drier over wetter signal. Then, warmer and drier conditions are resolved to retreat west-northwest September, ahead of a wetter shift for the west October onwards as anomalous warmth is projected to build back widely, consistent with +NAO trends there. A drier/less warm signal through the north for January should be monitored as a deviation from an otherwise +NAO dominated pattern and the emergence of any colder risks going forward.


Asia
A less anomalously hot and overall wetter signal is found across East Asia for August compared to other key cooling demand regions of the northern hemisphere. Muted heat is forecast for September, among an overall drier shift across much of East Asia – except for wetter eastern-northeastern Japan and far southeast China. A return of more widespread warmth is then projected from October onward, with a widely wetter shift developing for the mainland first (drier October for Japan) and then much of the region heading towards winter.


ENSO
The latest ECMWF ENSO projections show a significantly strong El Nino event developing later this year, with the ensemble mean lying between 3.5C and 4C as for NINO3.4 SST anomalies. There are indications that this Nino event could peak around the Nov-Jan timeframe.

Tropics
For mid-late Northern Hemisphere tropical seasons, the forecast remains largely subdued across the Atlantic basin, while a larger than normal number of storms is forecast across the Pacific, especially central to western sectors, including the northwest Pacific. However, overall lower than normal ACE levels are projected through all basins.

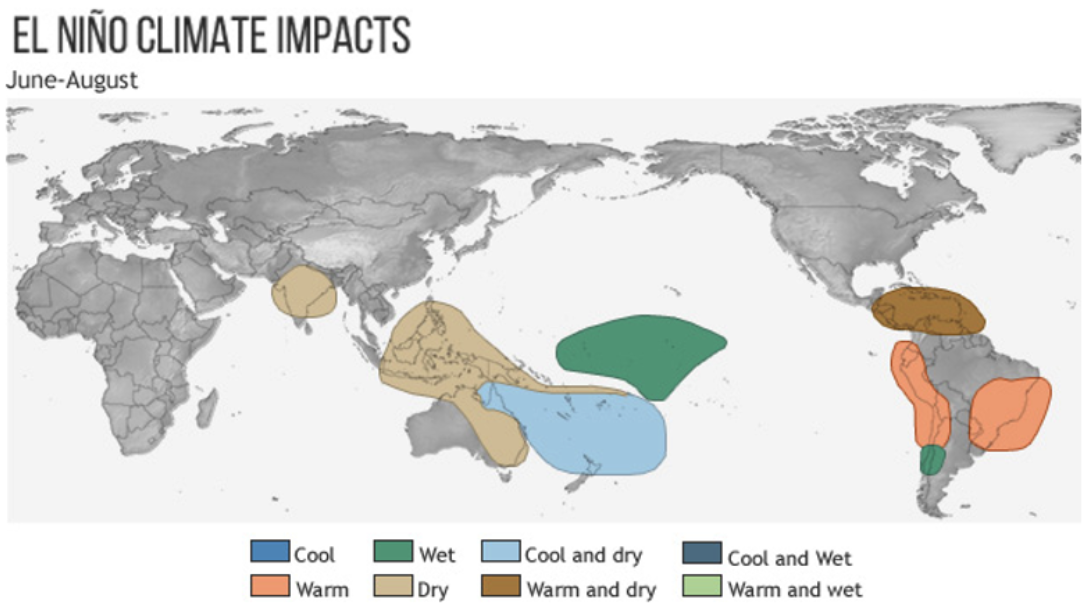
Below is an El Nino schematic as far as its typical impacts go. North America and Asia, where correlations are typically stronger, seem to closely respond to El Nino forcing heading into winter. The strength of El Nino could improve overall forecast confidence later this year into winter there. While in Europe, where correlations to ENSO signals are weaker, we may need to rely more on recent stronger El Nino analogs such as 2015/16 winter.

Bottom line: The latest ECMWF seasonal forecast points to a very strong El Niño developing later this year, with clearer impacts signaled across North America and Asia heading into winter, where ENSO correlations are typically stronger. For the US, the outlook highlights a hotter/drier late-summer risks across the Plains, Midwest and East, shifting toward a wetter coastal pattern and cooler southern-tier risks into winter, while East Asia trends less anomalously hot and wetter overall later in the year. Europe remains more uncertain given weaker ENSO teleconnections, though the forecast continues very hot into August before becoming warmer/wetter with +NAO type signals into fall/winter, while any drier/less warm northern deviation by January should be monitored for emerging colder risks. The tropical outlook remains subdued across the Atlantic, consistent with stronger El Niño-related shear, while storm counts lean higher across the Pacific, even though overall ACE values are projected somewhat below normal across all basins.
Published by Amy Hodgson
Here we take a look at the latest hydro situation across Brazil, and the precipitation outlook as we move through Spring and into Summer. The previous Brazil hydro blog issued in May can be found here https://www.ag2trader.com/1-15days/?blogPostID=190823
Brazil is one of the largest producers of hydroelectric power in the world, with the largest hydroelectric dam here being the Itaipu Dam. The primary reason for importing LNG into Brazil is to make up for the lack of electricity produced by the Itaipu Dam and other dams across Brazil, especially during times of drought. During times of drought, Brazil relies upon import LNG to meet its power needs. Therefore it’s crucial to monitor Brazilian precipitation.
Over the past 90 days, conditions have been slightly drier than normal across much of Brazil, except locally nearer normal across some western regions. While over the past 30 days, it’s been particularly dry across central-eastern Brazil, with wetter conditions to the south and west.

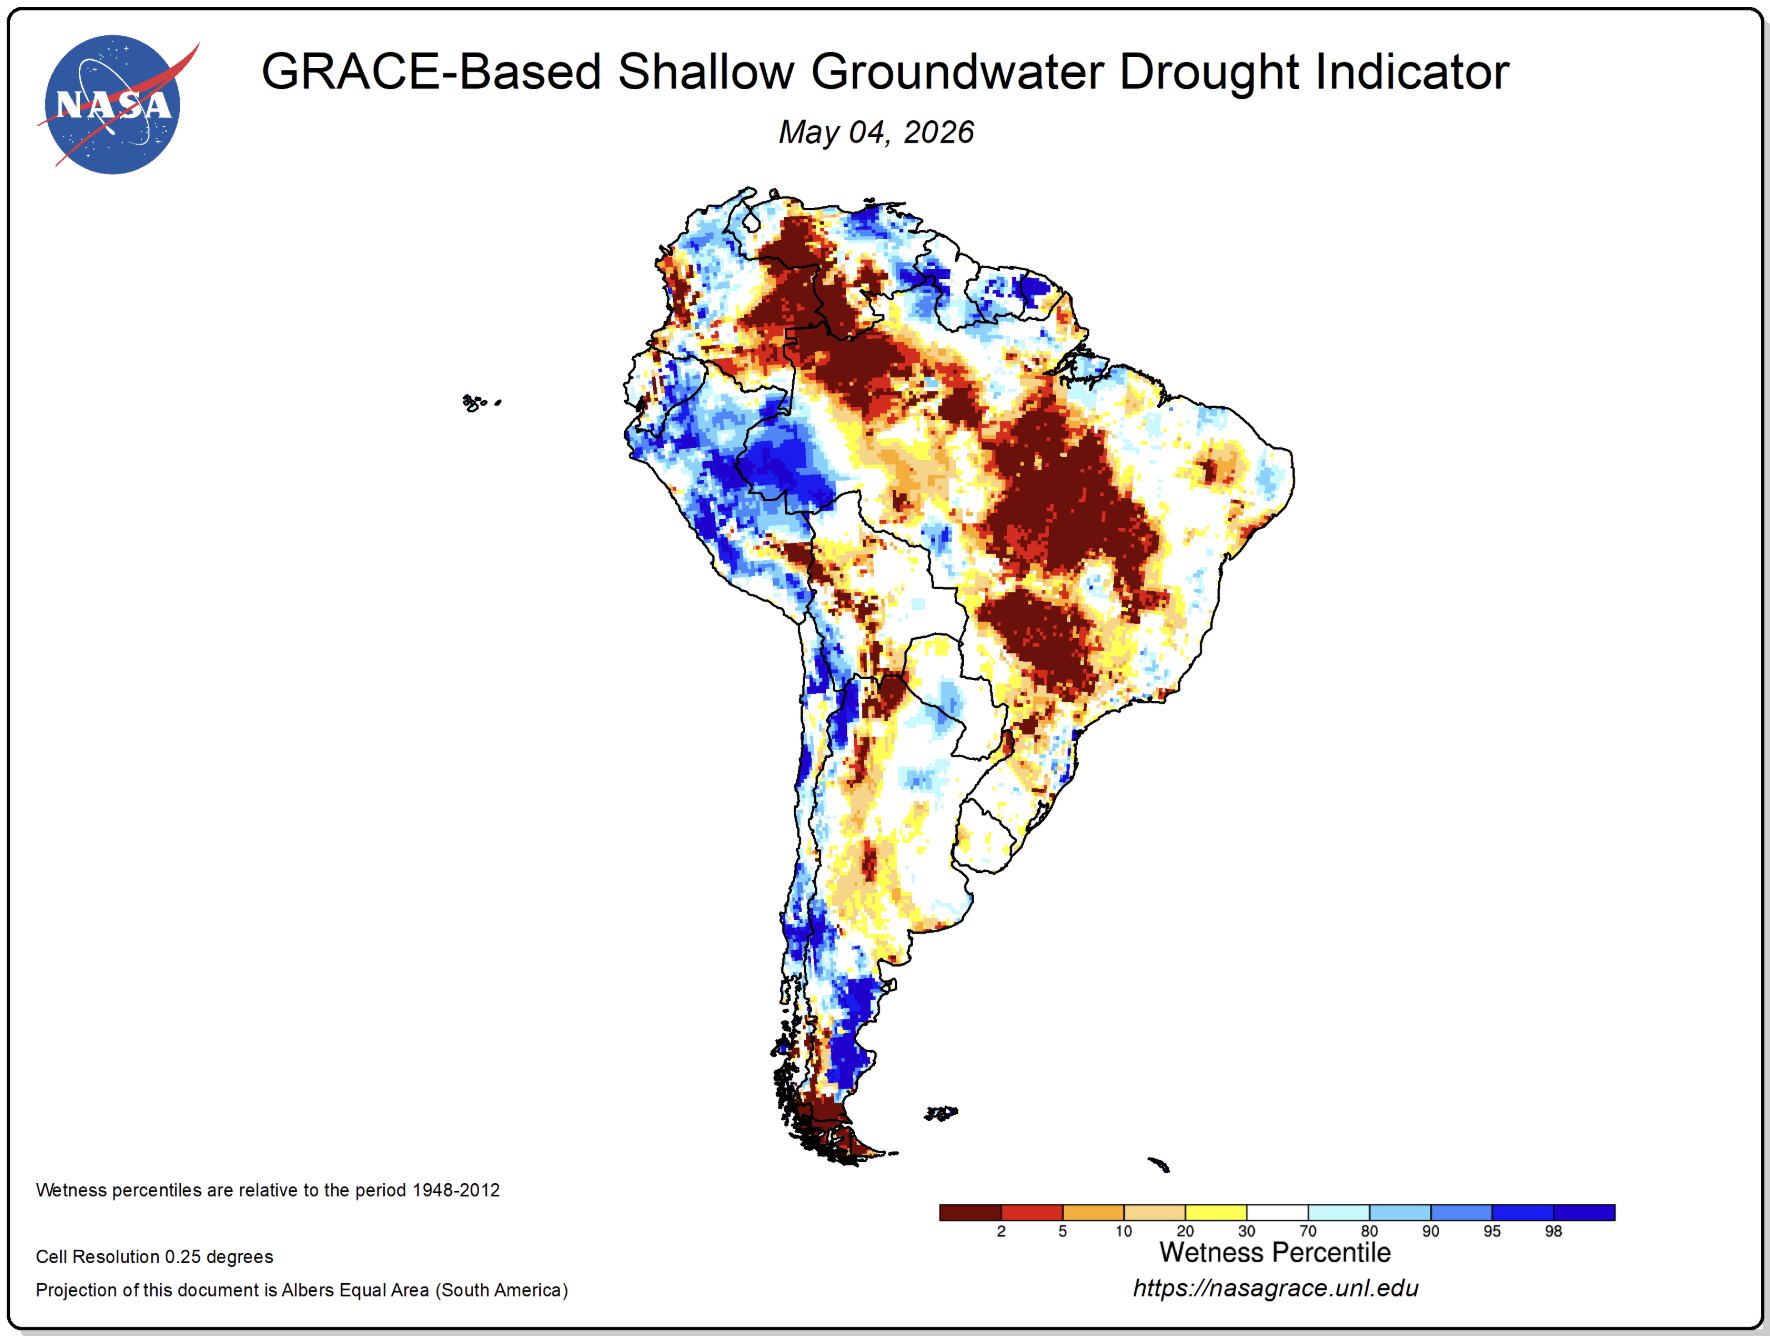
The latest soil moisture data from NASA shows largely dry soils, particularly across the interior regions of Brazil, although there are some localised wetter soils across east, south and west:

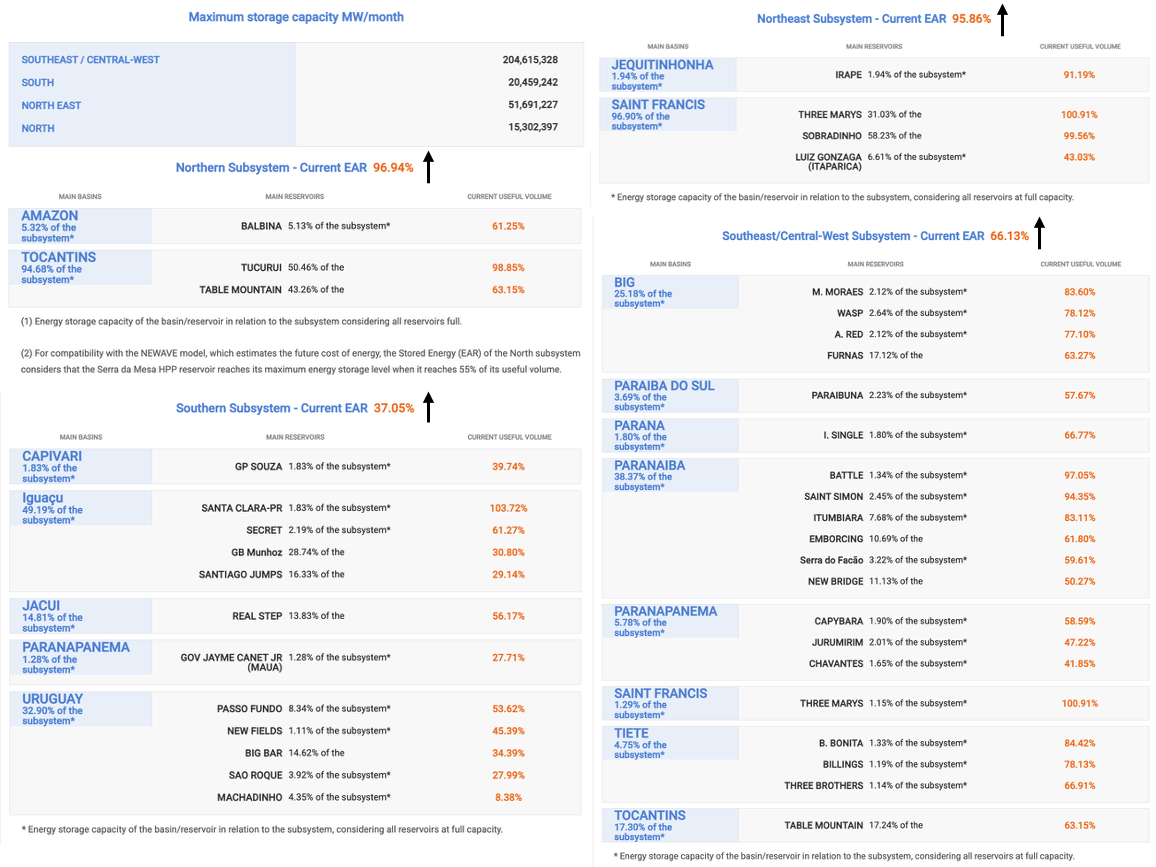
Now looking at the latest hydropower reservoir levels compared to our last update, levels have decreased across all regions, except for increasing for the southern subsystem.

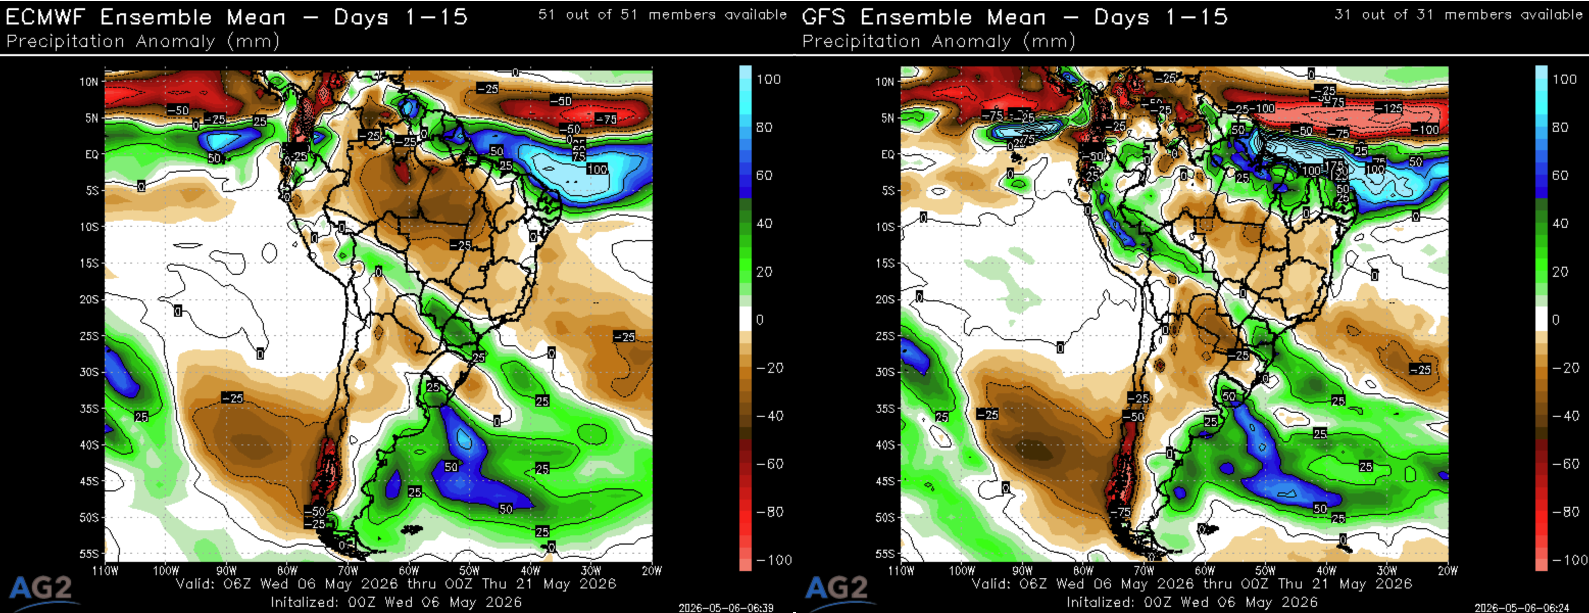
Now looking ahead to the forecast, the precipitation anomalies from the ECMWF and the GFS over the next 15 days are shown below. Generally a wetter outlook across much of Brazil, the exception being drier across the north-west and far south.

The latest ECMWF weekly for weeks 29 – 32 below shows a broad pattern of generally drier than normal conditions across the far north of Brazil, with wetter than normal conditions elsewhere.

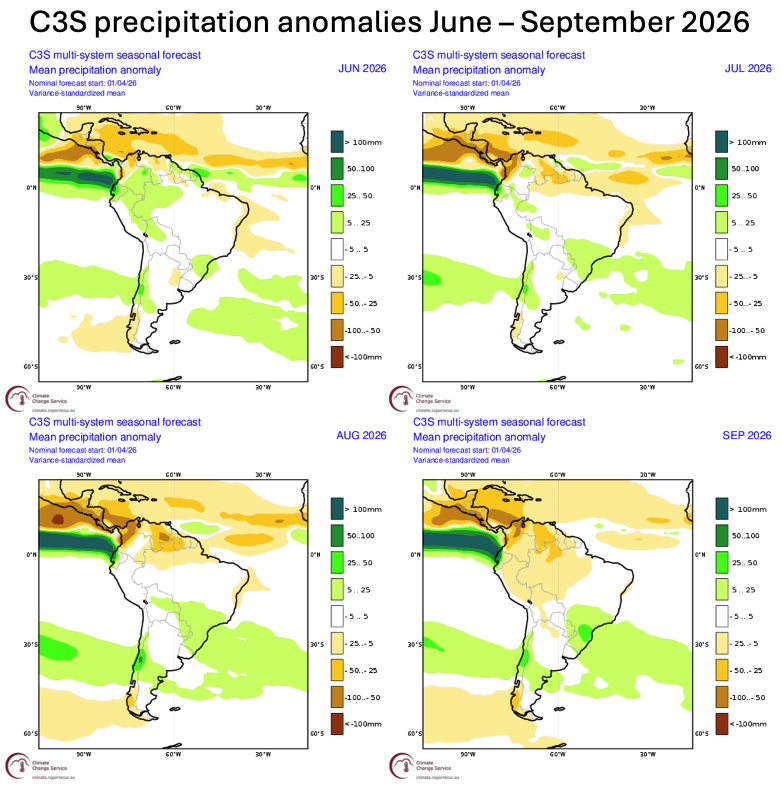
While the C3S seasonal guidance below shows a drier far north, wetter elsewhere pattern through the rest of summer, wettest to the far south. Then into autumn, generally drier than normal conditions across much of Brazil, with wetter conditions restricted to the far south.

A historically strong El Nino is forecast as we move through the rest of the year. El Nino conditions through summer, generally favour a drier Caribbean and into far northern Brazil as shown in the lower graphic below, which is in agreement with the C3S forecast for summer. Then during El Nino winters, the drier conditions spread across much or northern to central Brazil, with wetter conditions to the far south, which is the broad pattern as per the C3S into autumn.

Bottom line: Over the past month reservoir levels across Brazil have decreased for many regions, the exception being an increase in levels across the south. The forecast through the rest of summer is generally for drier than normal conditions across the far north of Brazil, with wettest conditions to the far south – this pattern is typical for El Nino summer. Then moving into autumn, the latest C3S is forecasting generally drier than normal conditions across much of Brazil, with wetter than normal conditions to the far south – which is the broad pattern expected during El Nino winters. Therefore hydro power in Brazil could become limited as we move through the El Nino autumn and winter, thereby impact LNG imports.
Published by Andrew Pedrini
Well above normal temperatures are forecast to return to C-W Europe next week heading towards mid-month.

Highs in the order of 30C or above are projected for cities across the British Isles going into next week, while into the mid-30’s and nearing 40C in France and Germany. WE ARE ONCE AGAIN TALKING OF ANOMALIES vs 30-YEAR NORMAL OF AROUND 10C, IF NOT LOCALLY HIGHER!
UK


FRANCE


GERMANY


After swinging W’wards for a time this week, higher pressure is forecast to move back in from the W next week towards mid-July. While the preferred EC (and AIFS, not shown here) point to a stronger high returning into Europe, GFS resolves a weaker ridge and less extreme risks for C Europe.

As per our population graphs below, there is overall good consistency in the warmer/hotter trend next week through C-W Europe, but confidence on the exact magnitude of the heat still being lower. ENS guidance tends to pose a less extreme risk to our AG2 forecast, especially GFS through C Europe in the longer range.


Bottom line: C-W Europe is facing a likely third heatwave of the season next week as higher pressure rebuilds from the W and pushes anomalous heat back into the heart of the continent toward mid-July. Highs are forecast to return to 30°C+ across the British Isles, while France and Germany could climb into the mid-30s to near 40°C, with departures once again around 10°C above 30-year normals, if not locally higher. Confidence is good on the broader warmer/hotter rebound, but lower on the exact magnitude of the heat, with EC/AIFS favoring a stronger and more extreme ridge while GFS offers a less intense risk later in the period at this time.
Published by Amy Hodgson
As Europe is under another extreme heatwave event, here we take a look at how these extremely high temperatures can actually reduce solar panel efficiency.
A counterintuitive but well-established phenomenon is that solar panels actually perform worse during heatwaves despite the abundant sunshine. More sun doesn’t necessarily mean higher solar output as the limiting factor here is the panel temperature.

Why?
Solar panels are semiconductor devices, and like all semiconductors, their efficiency degrades are temperature rises. For most modern silicon panels they lose approximately 0.3 to 0.5% per 1 degree C above 25 DegC. The relevant metric is the temperatures coefficient of power.
Panels absorb a broad spectrum of solar radiation, much of which converts to heat rather than electricity. Dark panel surfaces in full sun with no wind to cool them can run 20–35°C above ambient air temperature. During a heatwave, calm anticyclonic conditions, the same high pressure driving the heat, mean low wind speeds, so convective cooling of the panel surface is minimal. The effect is self-reinforcing: the clearer skies that maximise irradiance are the same conditions that maximise overheating.
A panel sitting in 40°C ambient air during a heatwave can reach a surface temperature of 65–75°C, meaning it may be operating 40–50°C above its rated condition — translating to a power output penalty of around 15–20% relative to its advertised capacity. So a panel that could produce 100 MW under standard conditions may only deliver ~84 MW despite bright sunshine.
The irradiance offset
Heatwaves do bring exceptionally high solar irradiance, which partially compensates for the efficiency loss. A cloudless heatwave day might deliver 10–15% more irradiance than a typical summer day, so the net effect on output is often roughly neutral or modestly positive compared to an average summer day — but substantially below what the same irradiance would produce in cooler conditions. The panel is effectively wasting some of the additional sunshine as heat.
Net effect
In most European heatwaves solar generation is still above average because sunshine is abundant. But output is lower than it would be under cooler sunny conditions. During a major heatwave in Germany for example, if the air temperatures is 35-40C, panel temperatures would likely reach 60-70C meaning an efficiency reduction of 10-18%. Yet solar production often remains near seasonal maxima because cloud cover is minimal and daylight is long.
Energy market implication
During a heatwave this matters for power markets because:
Solar: very high output, but below theoretical maximum
Wind: often suppressed under heat domes
Demand: rises sharply from cooling load
This can create strong midday solar production, steep evening ramps and higher power-price volatility.

Published by Ed Vallee
This blog takes an updated look at the developing El Nino into Summer and Fall of 2026 through the lens of the newly released IRI seasonal model…
To start, we can see the most recent region 3.4 value in the equatorial Pacific is up to 1.41°C (Nino threshold is 0.50°C). This indicates El Nino is rapidly coming on and we appear to be moving toward a moderate to strong El Nino for later 2026.

Looking basin-wide as of June 20, we can see all of the equatorial Pacific is warmer than the 1981-2010 normal now, actually…

The newest IRI forecast, which plots all seasonal ENSO models, was released yesterday. Model consensus favors a moderate to perhaps a strong El Nino, peaking this Fall at +2.6°C. There are quite a few models stronger, closer to +3°C.

A strong El Nino is becoming likely through the balance of 2026, rivaling the strongest events on record from 1997-1998 and 2015-2016. Keep tabs on this development via our seasonal reports, issued twice monthly for North America, Europe, and Asia.
Published by Takahisa Nishikawa
Summary: Two named tropical cyclones — MEKKALA and HIGOS — are simultaneously active in the western Pacific, with MEKKALA approaching the Nansei Islands on the 25th–26th and HIGOS forecast near Kanto on the morning of the 27th.
The main scenario is a southern coast passage for both systems; a Japan landfall scenario is flagged as sub-scenario at medium confidence, supported by some ECMWF, GFS, and AIFS solutions.
The more immediate market risk is Baiu front enhancement: both systems are supplying abundant moisture to the front, driving above-normal precipitation and suppressed solar irradiance across western and eastern Japan over the next five days.
The western Pacific is currently in an exceptionally active state, with two named tropical cyclones now in existence. MEKKALA and HIGOS — the latter newly named by both the JTWC and JMA — are tracking simultaneously toward the Japan region.

MEKKALA is located east of the Philippines and is expected to gradually weaken. It is forecast to approach the Nansei Islands between the 25th and 26th, raising the risk of heavy rainfall, strong winds, and high seas. The system is then expected to track along Japan’s southern coast.

HIGOS is near the Mariana Islands, tracking around the periphery of the Pacific High. While no significant intensification is forecast, the system is expected to approach the Kanto region around the morning of the 27th. At this stage, neither system is forecast to make landfall in Japan.

Google DeepMind model guidance broadly aligns with the JTWC track. However, ECMWF, GFS deterministic, and AIFS model runs show landfall scenarios for Japan in some solutions.

The overall assessment places a southern coast passage as the main scenario and a Japan landfall as the sub-scenario, with medium confidence on the five-day track for both systems.
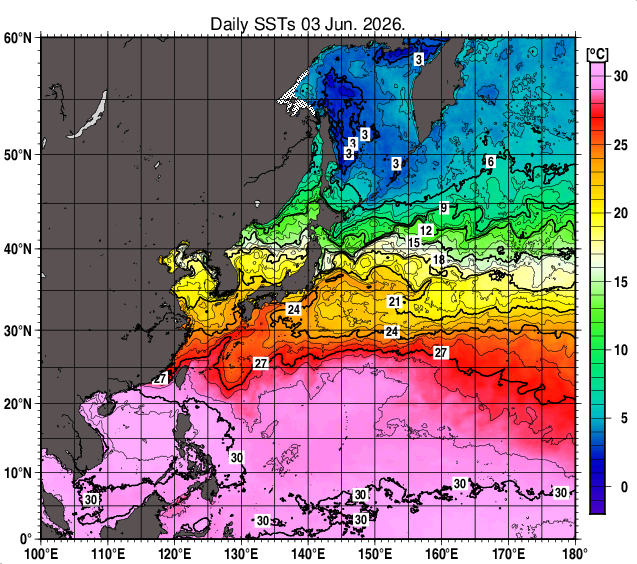
Current northwestern Pacific SSTs show waters above 27°C — the general threshold for tropical cyclone maintenance — limited to south of 25°N, with SSTs along Japan’s southern coast running below normal. This environment is increasingly unfavorable for intensification as both systems approach Japan.


However, the risk that deserves closest attention is not simply the tropical cyclones themselves, but the enhancement of precipitation along the Baiu front extending across the Japanese archipelago. Both systems are currently supplying abundant moisture to the front, creating a period highly conducive to increased rainfall. AG2’s own forecasts project above-normal precipitation along the Pacific coast of western and eastern Japan over the next five days.

Increased cloud cover will suppress temperatures, but solar irradiance will also fall well below normal. Western and eastern Japan therefore face a compound risk: tropical cyclone landfall, Baiu front activation and heavy rainfall, and suppressed solar generation — all of which require simultaneous monitoring.
Published by Amy Hodgson
Here we take a look at the outlook across Europe today (Friday 19th June) and through the weekend using the high resolution GRAF model.
Firstly the pressure pattern and precipitation forecast below. High pressure will dominate widely across the continent today and through the weekend, with very limited precipitation around. Today, a weak frontal system will bring some rain across north-western regions of the British Isles. There will also be some scattered showers across the Alps, with isolated showers across Iberia, northern France to Germany. Then through Saturday and Sunday, some isolated showers are forecast across parts of central and eastern Europe, and also Iberia, but it will remain dry across the majority of Europe.

Now onto winds, with high pressure dominating, calm conditions with mostly low winds are forecast across the continent. Moderate wind power potential is forecast across the British Isles today, with moderate to high potential for Sweden front weekend, otherwise elsewhere low potential.

For solar, with many clear sunny skies, solar irradiance will be high for most of Europe.

Finally, regarding temperatures, well above normal temperatures are forecast across western-central Europe. The latest AG2 forecast daily maximum temperatures are shown below. French temperatures for example are forecast to reach well into the 30s DegC, potentially reaching into the low 40s across the south-west by Sunday. These high temperatures present a downside risk to solar power potential as solar panels lose efficiency at high temperatures.

Bottom line: With high pressure in charge for most of Europe today and through front weekend, a dry, sunny and low wind outlook is forecast for the majority. The exception will be some wetter and slightly windier conditions across the north-west of the British today, and then some windier conditions are forecast across Sweden through front weekend. While there will be some isolated showers and thunderstorms across central and eastern Europe.
Published by Takahisa Nishikawa
Summary: A tropical disturbance near Guam is being monitored by the JTWC, with multi-model guidance suggesting tropical storm development and a possible landfall along Japan’s Pacific coast from Kyushu through Kanto on the 26th–27th.
Track, timing, and intensity at landfall remain highly uncertain, with typhoon-category landfall appearing unlikely at this stage.
From around the 23rd, the approaching system is likely to energize the Baiu front, raising precipitation risk across a broad area of Japan ahead of any potential landfall.
The JTWC is currently monitoring a tropical disturbance located approximately 500 NM east-southeast of Guam, with a medium probability of tropical cyclone development within 24 hours. ECMWF and GFS deterministic models are both tracking this signal.

The latest ECMWF and GFS tropical risk maps suggest that a tropical storm could develop and track toward Japan within the next two weeks. At this stage, landfall as a typhoon with maximum sustained winds of 64 knots or above appears unlikely.


Current sea surface temperatures across the northwestern Pacific show waters near 27°C — the threshold generally associated with tropical cyclone development and maintenance — extending northward to around 25°N, providing a conducive environment for intensification.

Looking across ECMWF Op, AIFS, GFS Op, and GFS ENS model guidance, all models except GFS ENS suggest the possibility of landfall along the Pacific coast of Japan from Kyushu through Kanto between the 26th and 27th. Model agreement on the track to Japan’s southern waters is relatively high, but track and intensity beyond that point carry significant uncertainty.

Google DeepMind ensemble guidance shows multiple members indicating landfall from Kyushu through the Kanto region around the 26th, with the majority of those members suggesting tropical storm category at landfall.

Should a tropical cyclone develop during the Baiu season, it is likely to energize the Baiu front, increasing precipitation, while areas to the south of the front may experience more humid and oppressive conditions as moist flow increases.
Published by Andrew Pedrini
All projections indicate that this next heatwave is going to hit hard. Higher pressure will rebuild over Europe this week bringing back clearer skies, plenty of sunshine (approaching Solstice), and very little gradient wind. Highest concerns should be kept around French nuclear, among all-around central European river stress, rising cooling demand, while risks of blackouts (infrastructure failures) and downside risks to solar through lower PV efficiency in peak heat should also be considered. France and surrounding areas is the most exposed region to sustained hot/dry conditions, impressing both in terms of magnitude and duration. Some mitigation is however expected for NE-E Europe next week, as the high nudges back W for a time.
Fiercely hot and dry conditions are forecast for Europe, especially though its C-W areas over the course of this back half of June.

This is due to capping high pressure returning over the continent, where it is expected to become slow moving.

Following up our blogs from last week, discussing upcoming risks of French nuclear curtailment and European river stress, we shall discuss today how the latest forecast updates highlight a concerning 10C+ anomaly signal in max temperatures through many cities in France, for at least a week or son from mid-this week to mid-next week. With limited mitigation to follow, this is a very impressive heatwave in terms of both magnitude and duration.

We are talking about max temperatures in the upper 30’s, nearing 40C across much of France later this week through early next week.

Very limited signs of relief are presently in sight for France through this back half of June.

Meanwhile, with peak heat maximum extent expected towards the weekend and opening of W26, there is a cooling signal for C Europe through the course of next week. Latest 00z EC OP and GFS OP suggest risks of dropping back to nearer normal temps next week, while AIFS OP turns the opposite way towards renewed extreme heat. Better confidence lies in ensemble guidance though, with the latest trend showing some hotter rebound in temps once again by the end of the month.

Next week in fact, the heat dome/ridging is forecast to nudge W’ward for a time, as lower heights deepen NE, allowing for come mitigation in the heat through cooler N’ly wind components across NE-E areas of Europe. The heat should however hold across W Europe under the continued protection of the high.

That high that is forecast to draw in once again per the latest EC ENS and AIFS ENS by the end of the month – hence those renewed hot trend towards the end of June per those solutions.

Bottom line: A fierce Solstice heatwave is set to grip much of Europe through the back half of June under a higher pressure regime, bringing very hot, dry, sunny and mostly calmer conditions, with France and surrounding areas most exposed to both impressive magnitude and duration. This maintains risks around French nuclear curtailment and broader central European river stress EXTREMELY HIGH, while also driving a strong surge in cooling demand, and adding (1) upside risks to infrastructure strain/blackouts, (2) downside risks to solar efficiency and in peak heat. Some mitigation is forecast next week for NE-E Europe as the high nudges W for a time, but W Europe should remain under persistent heat, with renewed hotter risks possible again toward the end of the month.
Published by
Summer weather risk in East Asia can move energy markets well before it appears in the short-range weather forecast.
For Japan, South Korea and China, subseasonal shifts in temperature, rainfall, solar radiation, humidity and tropical cyclone activity can affect power demand, solar generation, LNG and coal burn, hydro conditions and fuel logistics. A persistent heat pattern can lift cooling demand. A cloudy and wet regime can suppress daytime temperatures but also reduce solar output. Tropical disturbances can affect demand, generation, transmission, ports and fuel deliveries.
One useful framework for monitoring these risks at the two-to-four-week range is BSISO.
BSISO stands for Boreal Summer Intraseasonal Oscillation. It is a major intraseasonal mode of convection and circulation over the Asian summer monsoon region. In practical terms, it tracks the movement of enhanced tropical convection across the Indian Ocean, Bay of Bengal, South China Sea, Philippine Sea and western North Pacific during the boreal summer.
For energy traders, BSISO is not a deterministic forecast. It does not say, by itself, that Japan will be hot, Korea will be wet, or China will be cloudy. Instead, it provides a structured way to assess whether the subseasonal background is becoming more supportive of heat, rainfall, cloudiness, moisture transport or tropical cyclone activity.
The key point is that BSISO should not be used in isolation. It is most useful when combined with the MJO, subseasonal model guidance, 500 hPa height patterns, low-level moisture transport, the western North Pacific subtropical high, frontal positioning and tropical cyclone genesis conditions.

Figure 1. Conceptual BSISO phase geography. The numbered phases indicate the approximate location of enhanced convection as it propagates from the Indian Ocean toward the Bay of Bengal, South China Sea, Philippine Sea and western North Pacific. The map is schematic, not a deterministic forecast map.
What is BSISO?
BSISO is the dominant boreal-summer intraseasonal variability over the Asian monsoon region. It operates on a timescale longer than daily weather but shorter than seasonal climate, typically covering the 10-to-60-day range.
During active BSISO events, enhanced convection tends to migrate from the equatorial Indian Ocean toward the Bay of Bengal, South China Sea, Philippine Sea and western North Pacific. This evolution changes low-level winds, upper-level divergence, moisture transport, monsoon rainfall, tropical cyclone environments and the western North Pacific subtropical high.
This matters for energy markets because these circulation changes can influence several tradeable weather risks:
Temperature risk in Japan, South Korea and eastern China.
Rainfall risk associated with the Meiyu, Baiu and Changma frontal systems.
Solar radiation risk caused by persistent cloudiness and rainfall.
Humidity risk, especially where high dew points support stronger cooling demand even if daytime highs are not extreme.
Tropical cyclone risk across the South China Sea, Philippine Sea and western North Pacific.
Fuel demand and generation-mix implications for power, LNG, coal, hydro and renewables.
The practical value of BSISO is that it helps identify the type of weather regime that may become more likely in the subseasonal range. It is a regime-risk tool, not a point forecast.
How is BSISO different from the MJO?
To use BSISO effectively, it is important to distinguish it from the MJO.
The MJO, or Madden–Julian Oscillation, is a 30-to-60-day tropical intraseasonal oscillation. It typically propagates eastward along the equatorial belt from the Indian Ocean toward the Maritime Continent and the western Pacific. It is often particularly clear during boreal winter, but it remains useful in summer as a broad indicator of tropical convection.
BSISO is closely related to this type of tropical intraseasonal variability, but it is more specific to the Asian summer monsoon system. In summer, convection does not simply move eastward along the equator. It also propagates northward and northwestward into the monsoon region. This is the critical difference for East Asian weather risk.
For East Asia, MJO alone may show the broad tropical convection background, but it may not fully capture the northward shift of convection into the Bay of Bengal, South China Sea, Philippine Sea and western North Pacific. BSISO helps track that monsoon-region propagation.
In operational terms, the two should be used together.
Use the MJO to understand the broad tropical convective background across the Indian Ocean, Maritime Continent and western Pacific.
Use BSISO to understand the boreal-summer monsoon-region signal, especially northward and northwestward propagation toward the Bay of Bengal, South China Sea, Philippine Sea and western North Pacific.
For Japan, South Korea and China, this combined view is more useful than using either index alone.

Figure 2. MJO versus BSISO. MJO is often interpreted as an equatorial eastward-propagating convective signal, while BSISO emphasizes the boreal-summer northward and northwestward propagation that is especially relevant for Asian monsoon rainfall, tropical cyclone risk and East Asian moisture transport.
BSISO1 and BSISO2: why traders should care about both
BSISO is commonly monitored through two indices: BSISO1 and BSISO2. They are related but not interchangeable.
BSISO1 mainly captures the lower-frequency, larger-scale component of the summer intraseasonal signal. It is closer to a 30-to-60-day mode and is useful for identifying the broader monsoon background. It can help assess whether the large-scale environment is becoming more supportive of active monsoon conditions, broad moisture transport and sustained circulation anomalies.
BSISO2 captures a higher-frequency component, closer to the 10-to-30-day range. It is often more directly linked to northward and northwestward convective variations over the Bay of Bengal, South China Sea, Philippine Sea and western North Pacific. In practice, BSISO2 can be especially relevant for rainfall, cloudiness, moisture surges, tropical cyclone genesis environments and shorter subseasonal shifts.
A simple way to remember the difference is this:
BSISO1 is the larger-scale background.
BSISO2 is the shorter-period convection, rainfall, moisture and tropical-cyclone-environment signal.
This distinction is important for market interpretation.
If BSISO1 and BSISO2 both point toward phases 5 to 7, confidence tends to increase that convection may become more active across the South China Sea, Philippine Sea and western North Pacific. That would raise attention on East Asian rainfall, tropical disturbance risk and possible humidity-driven demand effects.
If BSISO1 is weak but BSISO2 is active, the signal should be treated more carefully. That pattern may not imply a persistent large-scale heat regime. It may instead indicate shorter-period rainfall, moisture transport, cloudiness and solar-risk episodes.

Figure 3. Operational difference between BSISO1 and BSISO2. BSISO1 is more useful for the large-scale monsoon background, while BSISO2 is often more relevant for shorter-period rainfall, moisture, tropical-cyclone-environment and solar-risk signals.
What do phases 1 to 8 mean geographically?
BSISO is usually shown in phase space, with phases 1 through 8 indicating the approximate location of enhanced convection.
A simplified geographic interpretation is:
Phase 1: western equatorial Indian Ocean.
Phase 2: eastern equatorial Indian Ocean.
Phase 3: Bay of Bengal to eastern India.
Phase 4: northern Bay of Bengal to South China Sea.
Phase 5: South China Sea to northern Maritime Continent.
Phase 6: Philippine Sea to western North Pacific.
Phase 7: south of Japan to the northwestern part of the western North Pacific.
Phase 8: eastern side of the western Pacific and transition toward the next cycle.
For East Asian energy markets, phases 4 through 7 are especially important.
Phases 4 and 5 tend to focus attention on the Bay of Bengal, South China Sea and southern China moisture corridor. This can be relevant for rainfall risk in southern China, the Yangtze River basin, Taiwan, the Ryukyu Islands and western Japan, depending on the frontal pattern.
Phases 5 and 6 shift attention toward the South China Sea, Philippine Sea and western North Pacific. This is the stage where tropical disturbance risk and moisture supply toward East Asia often become more relevant.
Phases 6 and 7 bring the signal closer to Japan, South Korea and eastern China. Depending on the western North Pacific subtropical high and frontal positioning, this can support either a hot and humid pattern or a wet, cloudy and frontal-rainfall pattern.
This is why phases 5 to 7 receive particular attention in East Asian summer energy-market monitoring.
How BSISO affects temperature, rainfall and solar radiation
BSISO affects energy markets through multiple weather variables. Temperature is important, but it is not the only variable that matters.
Temperature risk depends heavily on the western North Pacific subtropical high, ridge-trough positioning and cloud cover. If the subtropical high expands northwestward toward Japan, South Korea and eastern China, the region may turn hotter and more humid. This can lift cooling demand, especially where nighttime minimum temperatures remain elevated.
Rainfall risk depends on the interaction between BSISO-related tropical convection and the East Asian frontal zone. If enhanced convection over the South China Sea or Philippine Sea strengthens moisture transport into the Baiu, Meiyu or Changma front, rainfall risk can increase across Japan, Korea and eastern China. This can suppress daytime temperatures but raise flood, logistics and hydro-related risks.
Solar radiation risk is also critical. More cloud cover and rainfall can reduce solar generation. In markets with high solar penetration, a cloudy and wet regime can tighten the supply-demand balance even if cooling demand is not especially strong. This is why rainfall and solar risk should be evaluated together, not separately.
Humidity risk can complicate the signal. A wet pattern may lower daytime maximum temperatures, but high humidity and warm nights can keep power demand resilient. For load forecasting, dew point and nighttime minimum temperature can be as important as daily maximum temperature.
Tropical cyclone risk is another important channel. When BSISO supports enhanced convection across the South China Sea, Philippine Sea and western North Pacific, tropical cyclone genesis environments may become more favorable. Tropical cyclones can affect power demand, transmission infrastructure, generation availability, LNG and coal logistics, port operations and industrial activity.

Figure 4. Translating BSISO into energy-market risk. BSISO affects energy markets through convection, moisture transport, subtropical-high positioning, frontal activity, tropical cyclone environments, cloud cover and solar radiation. The market impact depends on how these meteorological drivers translate into demand, generation and logistics.
Model verification: which BSISO forecast should be emphasized?
BSISO forecasts are available from multiple models, but not all models should be given equal weight. Forecast skill varies by model, lead time, index and season. For operational use, model verification matters.
APCC BSISO verification provides a useful reference for comparing model performance. Based on the all-available-period verification chart, ECMWF shows relatively stable skill across BSISO1 and BSISO2. In particular, ECMWF appears comparatively robust for BSISO2 at subseasonal lead times, with relatively slower degradation in correlation, controlled RMSE growth and stronger MSSS compared with several other models.
This matters because BSISO2 is often the more practically relevant signal for short-period convection, rainfall, moisture transport, tropical cyclone environments and solar-risk episodes around East Asia.
GFS and CFS can still provide useful scenario information, especially at shorter lead times, but their skill may degrade more noticeably at longer leads. CFS in particular can become unstable in some BSISO2 verification metrics at longer leads. BOM and CWA can be useful supporting references, but a practical approach is to use ECMWF as the anchor model and compare other models for confirmation or alternative scenarios.
The goal is not to follow one model blindly. The goal is to weight the forecast evidence. If ECMWF and other models agree on BSISO phase progression and amplitude, confidence is higher. If ECMWF suggests a signal but other models diverge, the market conviction should be reduced.
When using APCC verification graphics, one caution is necessary: if the chart does not explicitly state the verification period, the period should not be over-specified. In that case, it is safer to describe the result as an all-available-period verification rather than assigning exact start and end dates.

Figure 5. APCC BSISO verification over the all-available-period sample. ECMWF is used as the anchor model in this framework because it shows relatively stable skill across BSISO1 and BSISO2, especially for BSISO2 at subseasonal lead times. The exact verification period should not be over-specified unless the underlying APCC data range is explicitly documented.
A practical monitoring framework for energy traders
BSISO is most useful when integrated into a repeatable workflow.
The first step is to check the MJO. Is there a coherent tropical convective envelope? Is it located over the Indian Ocean, Maritime Continent or western Pacific? Is the amplitude meaningful or weak?
The second step is to check BSISO1 and BSISO2. Is BSISO1 showing a clear large-scale monsoon background? Is BSISO2 moving toward phases 4 to 7? Are the two indices aligned or conflicting?
The third step is to assess model confidence. ECMWF should usually be the anchor model, but the forecast should be compared with BOM, CWA, GFS and CFS where available. Model agreement raises confidence; model divergence lowers it.
The fourth step is to verify the circulation fields. The most important fields include 500 hPa height anomalies, 850 hPa winds and moisture transport, 200 hPa velocity potential, western North Pacific subtropical high position, frontal placement and tropical cyclone genesis conditions.
The fifth step is to translate the weather signal into market variables. This means moving from meteorology to demand, generation and logistics. Temperature, rainfall, solar radiation, humidity, nighttime minimum temperature, tropical cyclone risk, fuel burn and renewable output should be evaluated together.
A practical checklist is:
Is the MJO coherent and active?
Are BSISO1 and BSISO2 aligned?
Is BSISO2 moving into phases 4 to 7?
Does ECMWF agree with other models?
Is the 500 hPa pattern supportive of a ridge or trough over East Asia?
Is 850 hPa moisture transport aimed toward Japan, Korea or eastern China?
Is the western North Pacific subtropical high expanding northwestward?
Where are the Baiu, Meiyu and Changma frontal zones likely to sit?
Are tropical cyclone genesis conditions improving?
Does the final signal imply heat demand, rainfall risk, solar downside, humidity-driven demand or logistics risk?

Figure 6. Operational workflow for using MJO and BSISO in energy-market analysis. The index signal should be connected to model confidence, circulation fields, country-level weather risks and market variables.
How to read BSISO for energy-market impact
The value of BSISO is not in naming the phase. The value is in translating phase progression into energy-relevant risks.
For example, if BSISO2 is near phases 4 to 5, the main signal may be enhanced convection from the Bay of Bengal and South China Sea toward the northern Maritime Continent and Philippine Sea. For Japan, South Korea and eastern China, this does not automatically mean a heat-demand bullish pattern. It may first imply greater attention to moisture transport, rainfall, cloud cover, lower solar radiation and tropical disturbance risk.
If BSISO2 advances into phases 5 to 7 while the western North Pacific subtropical high expands northwestward, the interpretation can shift. In that case, hot and humid conditions may become more likely across parts of Japan, Korea and eastern China, lifting cooling demand.
If instead the frontal zone remains over East Asia and tropical moisture feeds into it, the more important risk may be rainfall, cloudiness and lower solar output. Daytime temperatures may be suppressed, but humidity and warm nights can still support power demand.
If tropical disturbances develop, the market impact broadens beyond temperature and solar. Tropical cyclone risk can affect demand, generation, transmission, LNG deliveries, coal logistics, ports and industrial operations.
Therefore, the same BSISO phase can have different market implications depending on the subtropical high, frontal position and midlatitude circulation. BSISO provides the tropical-convective framework, but the market signal comes from the full weather regime.
Conclusion
BSISO is a useful tool for monitoring summer subseasonal weather risk across East Asia. For Japan, South Korea and China, it can help identify shifts in temperature, rainfall, solar radiation, humidity and tropical cyclone risk two to four weeks ahead.
However, BSISO should not be used alone. The most robust approach is to combine MJO for the broad tropical background, BSISO for Asian monsoon-region propagation, ECMWF and other S2S guidance for forecast confidence, and circulation fields for the actual weather pattern.
Model verification supports using ECMWF as the anchor model for BSISO monitoring, particularly for BSISO2 at subseasonal lead times. Other models remain useful as confirmation or alternative scenarios, but the forecast should be weighted by historical skill and current model agreement.
For energy traders, BSISO is not simply a “heat” indicator. It is a framework for monitoring multiple weather-driven market risks: cooling demand, rainfall, cloudiness, solar generation, humidity, tropical cyclones, fuel burn and logistics.
In East Asian summer markets, the most useful question is not only whether it will be hot. It is whether the evolving tropical and monsoon background is setting up a heat-demand regime, a wet-and-cloudy solar-risk regime, a tropical-cyclone-risk regime, or some combination of these. BSISO, used together with MJO and model guidance, helps structure that assessment.
Published by James Caron
The ERCOT forecast has continued to trend in the direction we were watching for, with warmer changes showing up from June 18 onward. This supports the idea that the cooler, wetter pattern across Texas is beginning to break down, while the large-scale upper-air pattern becomes more favorable for heat to expand across the state.
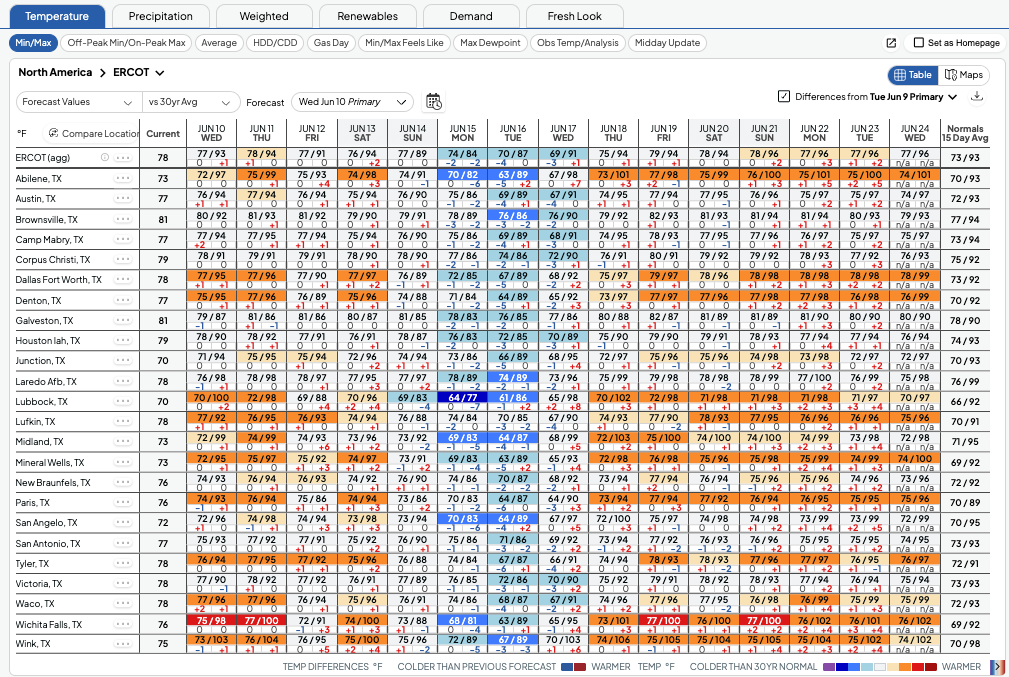
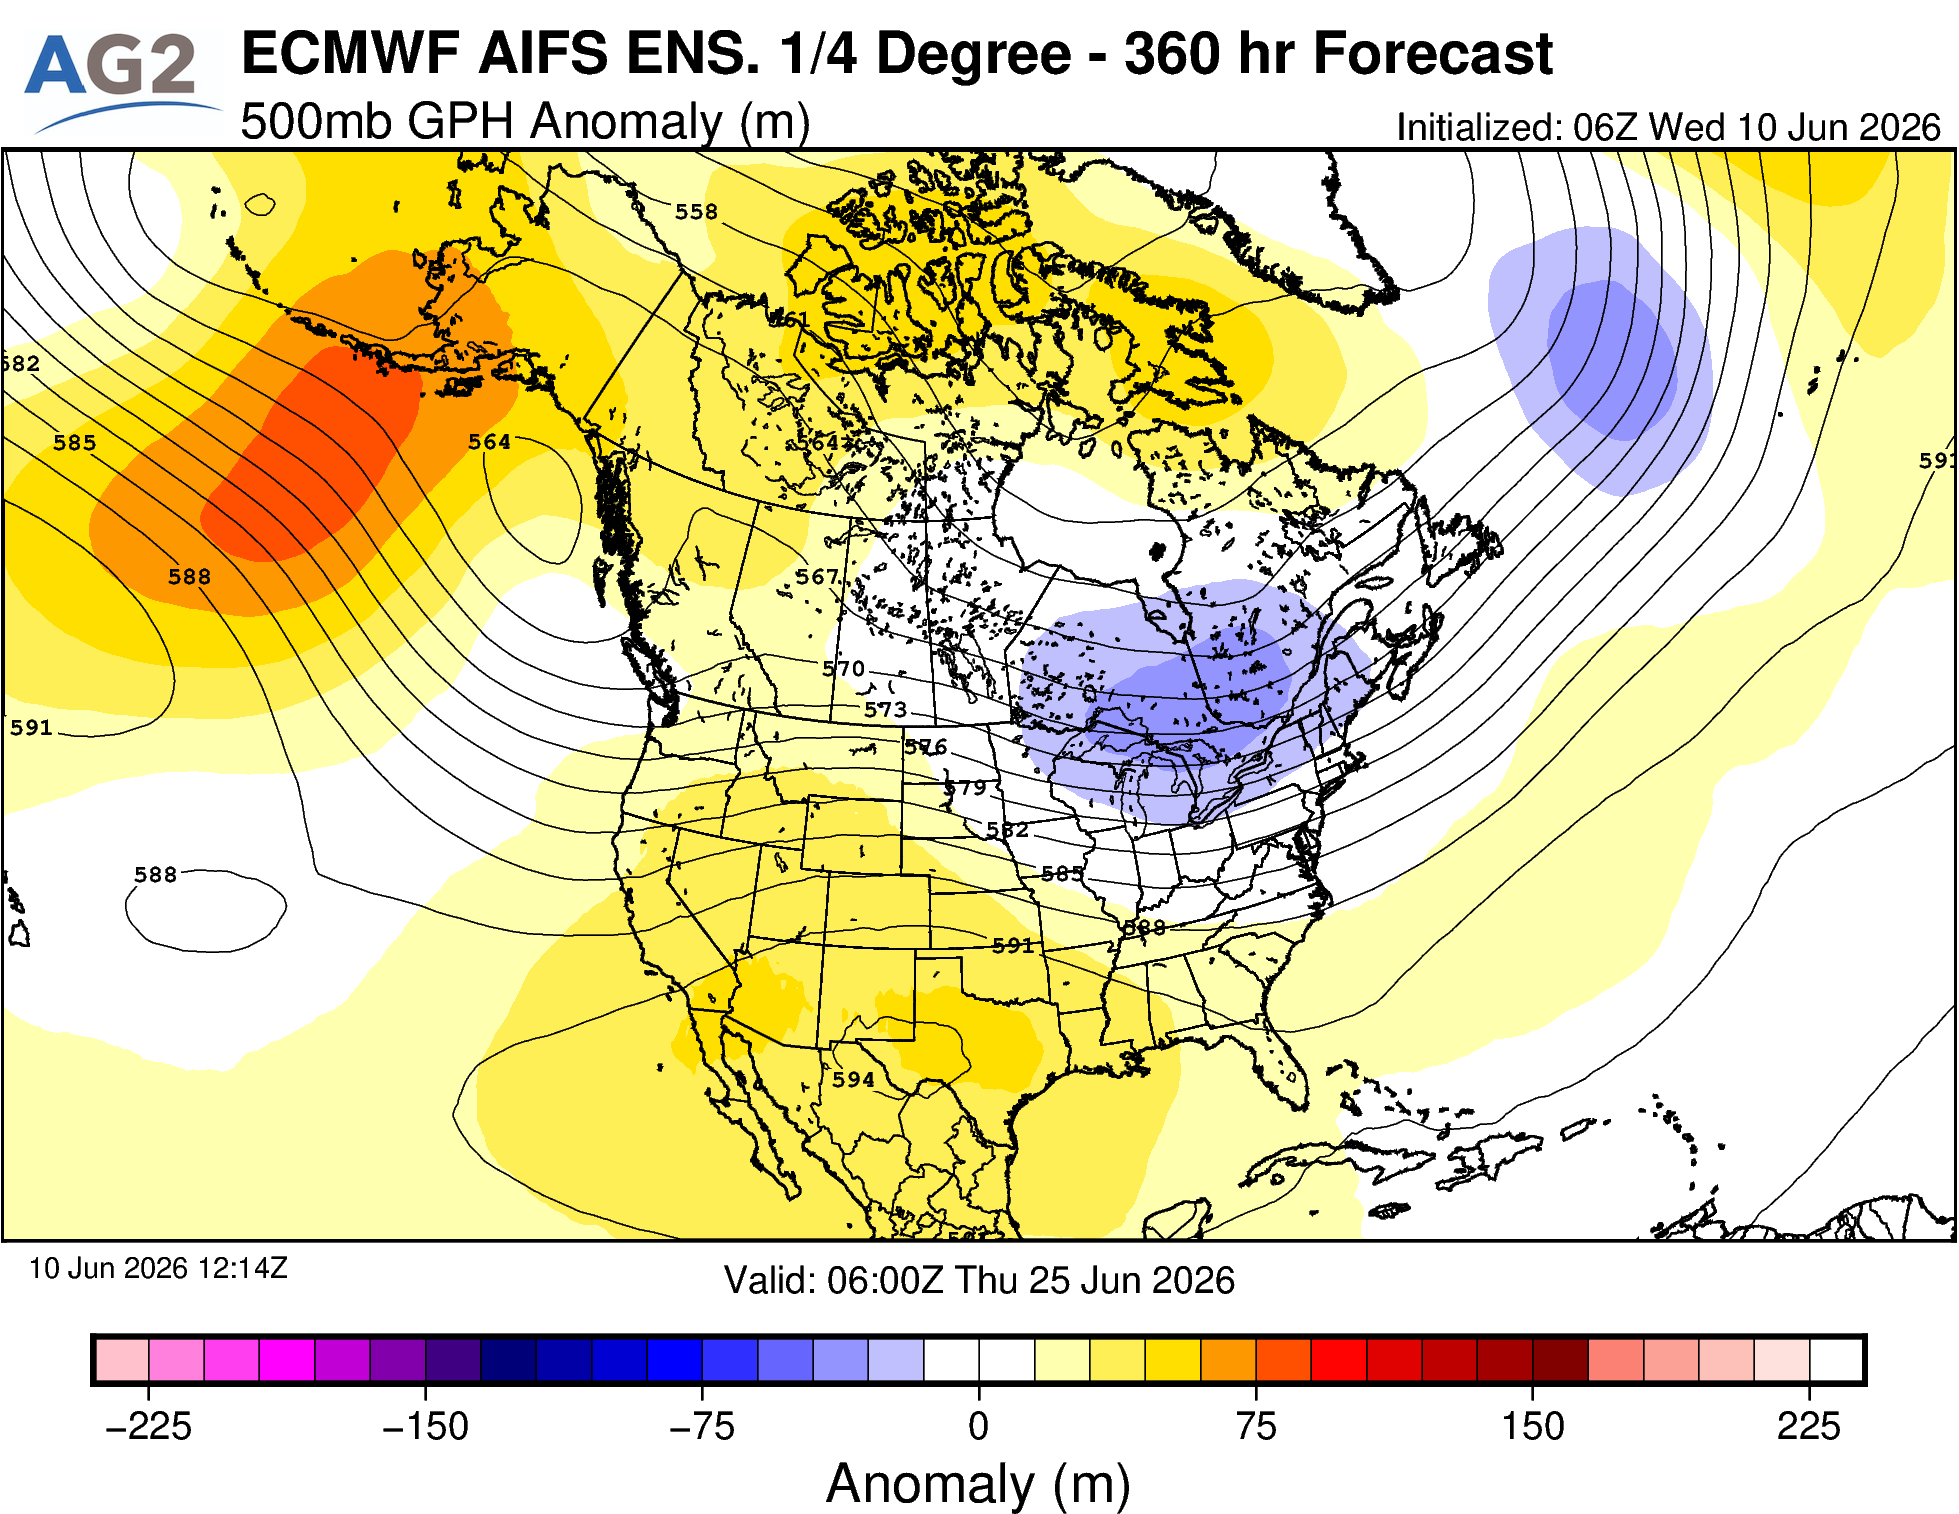
The key driver remains the evolving 500mb setup. A trough over the Midwest and Northeast is expected to compress the ridge southward into Texas and the southern Plains. When that happens, the ridge does not necessarily need to be centered directly over ERCOT to produce heat. The compression itself can help strengthen subsidence, limit cloud cover, and support a hotter, drier surface pattern across Texas.
That is important because the temperature forecast is already responding. From roughly June 18 through the week ending Friday, June 26, warmer changes are showing up across the ERCOT cities. The current forecast has moved warmer during this period, but there may still be additional upside risk if the ridge compression verifies or strengthens further.
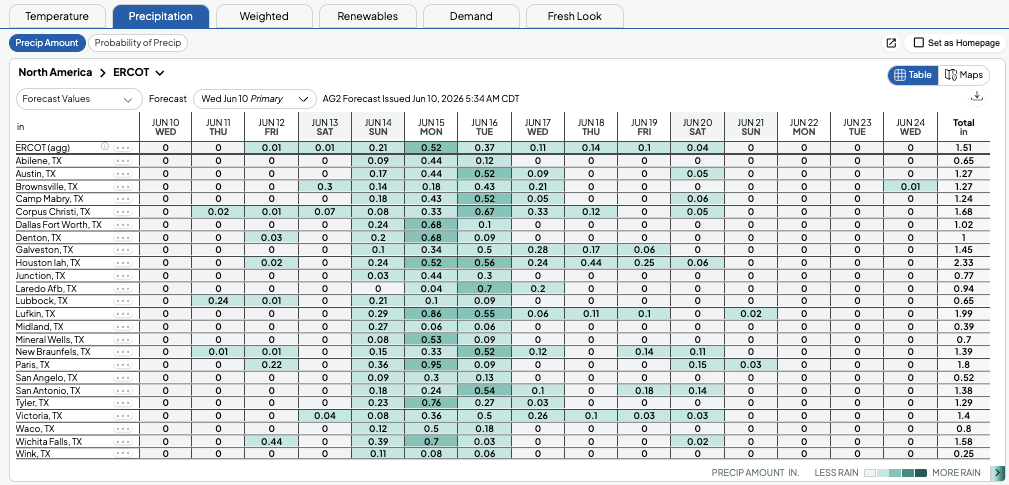
Another notable change is precipitation. The forecast is finally showing a meaningful decrease in rainfall coverage after the mid-month period. Earlier in the outlook, Texas still has scattered precipitation chances, especially around June 15–18. However, after June 18, rainfall becomes much more limited across the ERCOT footprint. That reduction in precipitation is a key reason the warmer pattern has more room to develop.
That is important because the temperature forecast is already responding. From roughly June 18 through the week ending Friday, June 26, warmer changes are showing up across the ERCOT cities. The current forecast has moved warmer during this period, but there may still be additional upside risk if the ridge compression verifies or strengthens further.
Another notable change is precipitation. The forecast is finally showing a meaningful decrease in rainfall coverage after the mid-month period. Earlier in the outlook, Texas still has scattered precipitation chances, especially around June 15–18. However, after June 18, rainfall becomes much more limited across the ERCOT footprint. That reduction in precipitation is a key reason the warmer pattern has more room to develop.
Published by James Caron
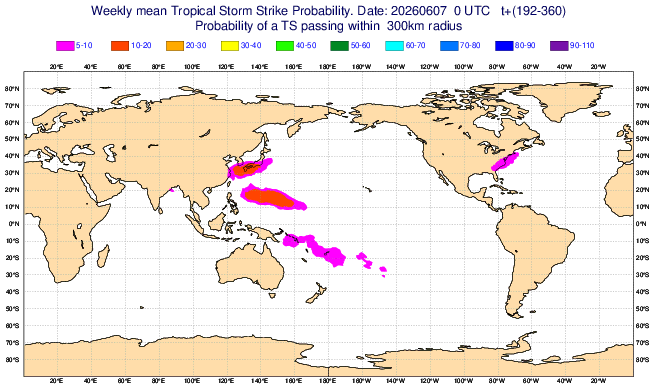
Days 1–8: Tropical Threat Outlook
The near-term forecast keeps the most focused tropical storm strike probabilities in the western Pacific, with a compact but notable threat signal east of Taiwan and near the southern Ryukyu Islands extending toward the East China Sea. A smaller area of risk is also indicated near Central America, focused around southern Mexico, Guatemala, and nearby Pacific/coastal waters. Elsewhere, only isolated low-probability pockets appear, including near the Bay of Bengal, the central South Pacific, the southwest Indian Ocean, and a small feature in the North Atlantic, suggesting limited organized tropical threat outside the western Pacific and Central America during this first forecast window.
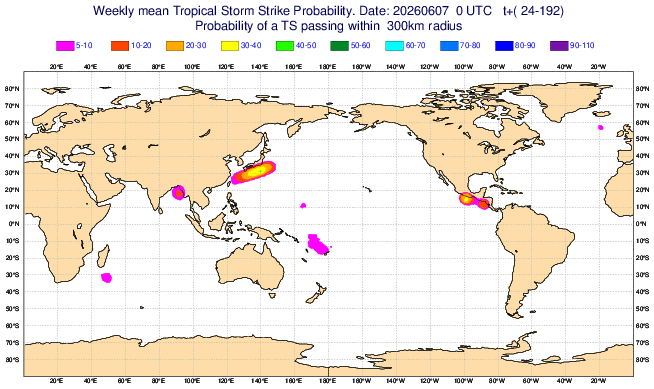
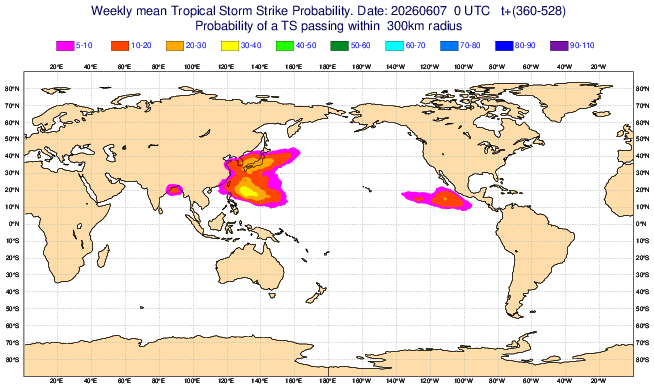
Days 8–15: Tropical Threat Outlook
During the second forecast period, the western Pacific threat expands and becomes more elongated, with strike probabilities stretching from the South China Sea and Philippines eastward across the Philippine Sea and into waters south of Japan. The strongest signal remains in the western North Pacific, suggesting an active basin with potential tracks that could affect the Philippines, Taiwan, the Ryukyus, or nearby shipping lanes depending on storm evolution. A separate low-probability area appears near Central America and southern Mexico, while another tropical signal emerges across the southwest Pacific near Papua New Guinea and island areas east of Australia, indicating broader but generally lower-confidence tropical development potential.
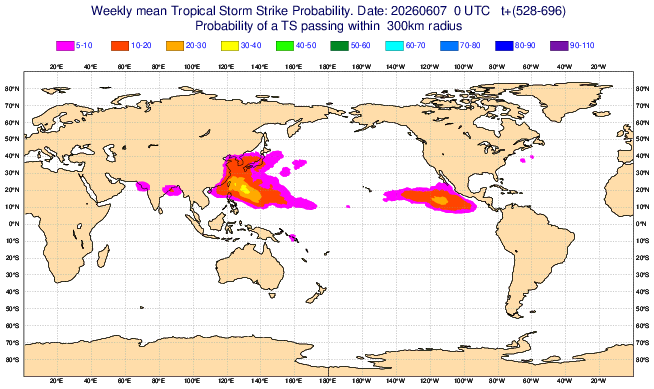
Days 15–22: Tropical Threat Outlook
By the third forecast map, the western Pacific becomes the dominant global tropical concern. Probabilities increase and broaden from the South China Sea through the Philippines and into the Philippine Sea, with the highest concentration of risk near and east of the Philippines, extending northward toward Taiwan, the Ryukyus, and waters south of Japan. This pattern points to a more favorable large-scale environment for tropical cyclones in the western North Pacific, with multiple possible threat corridors for East and Southeast Asia. The eastern Pacific also shows a more defined area of risk west of Central America and southern Mexico, suggesting tropical activity may become better organized there as well.
Days 22–29: Tropical Threat Outlook
The final forecast window continues to highlight an active western Pacific, with broad tropical storm strike probabilities covering the South China Sea, the Philippines, the Philippine Sea, Taiwan vicinity, and areas extending northeastward toward Japan. The risk footprint is large, which implies either increased uncertainty in possible tracks or potential for multiple systems across the basin. The eastern Pacific remains another important region to watch, with probabilities concentrated well south and southwest of Mexico and Central America, possibly tied to developing tropical activity moving westward offshore. Additional low-probability areas appear near India and the northern Indian Ocean, but the main tropical threats remain centered on the western Pacific and the eastern Pacific.
Published by Takahisa Nishikawa
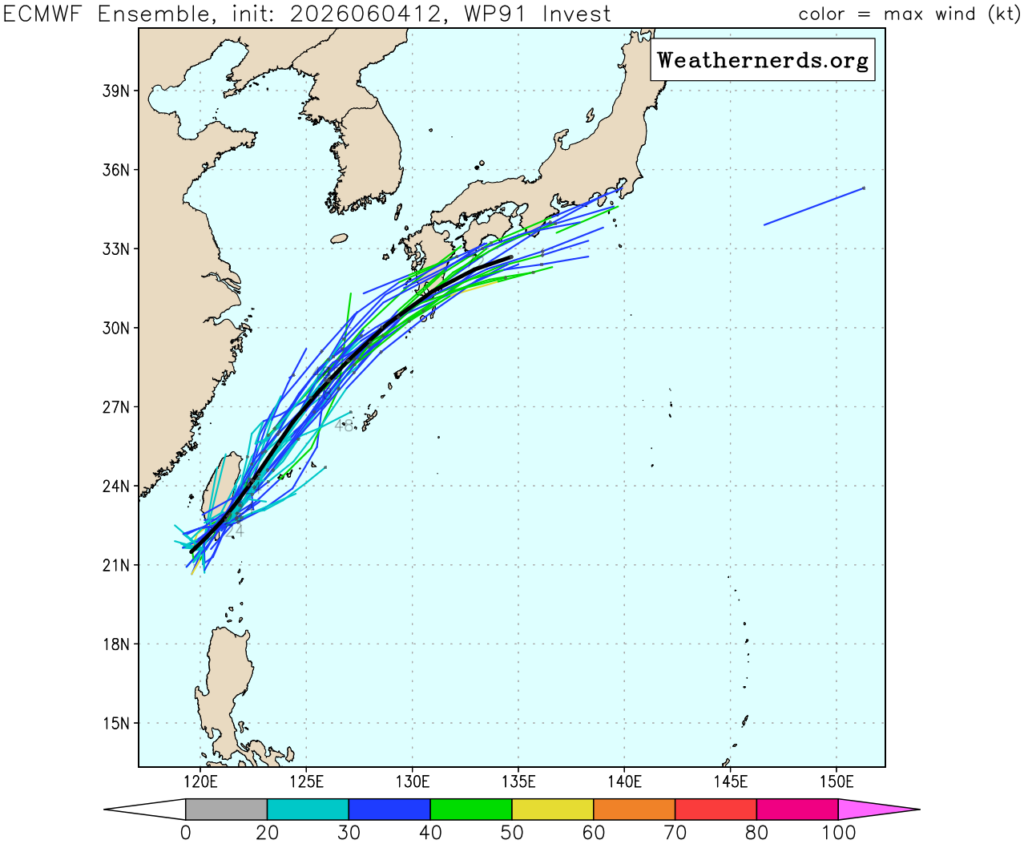
Summary TS Jangmi brought heavy rainfall to Japan’s Pacific coast on June 3 before moving off to the east. A new tropical depression has since developed near Taiwan and warrants close attention. While rapid intensification looks unlikely given below-normal SSTs in Jangmi’s wake, the primary risk is a scenario where the system continuously feeds warm, moist air into a stalled front near southern Kyushu, triggering potentially severe rainfall around June 7. For energy markets, the focus is on the impact to large-scale solar installations in Kyushu and the region’s renewable generation and supply-demand balance.
Jangmi Has Cleared — But a New System Is Developing
TS Jangmi brought heavy rain to Japan’s Pacific coast on June 3 before tracking east. Attention now shifts to a new tropical depression that has developed near Taiwan. The latest ECMWF ensemble guidance suggests this system will track northeast, potentially following a path similar to Jangmi’s.
Rapid Intensification Unlikely
Significant intensification looks unlikely at this stage. Sea surface temperatures in the waters Jangmi passed through are running below normal, and the area with SSTs above 26.5°C — the threshold generally considered necessary for tropical cyclone development and maintenance — is limited. A rapid intensification scenario is therefore assessed as low probability.
The Primary Risk: Frontal Rainfall Enhanced by Moist Tropical Inflow
The scenario that warrants the most attention is not a direct typhoon strike, but rather the continuous injection of warm, moist air from the south that could activate a stalled front near southern Kyushu. Current guidance points to the risk of very heavy rainfall across southern Kyushu and the Pacific side of Shikoku, centered around June 7. Localized totals could be significant, raising the risk of landslides, flooding in low-lying areas, and river level rises. It is worth recalling that Jangmi triggered river flooding in parts of Wakayama Prefecture — a similar risk could materialize depending on rainfall totals this time.
Energy Market Implications: Kyushu Solar in Focus
From an energy market perspective, the key area to watch is Kyushu. Southern Kyushu and Miyazaki Prefecture host a large number of utility-scale solar installations, and heavy rainfall raises the risk of slope failures, sediment intrusion, and road closures that could directly or indirectly affect generating capacity.
Persistent thick cloud cover is also expected to suppress solar output significantly, with implications for Kyushu’s renewable generation outlook and regional supply-demand balance. Continuous monitoring will be essential through the weekend.
In short, the primary risk scenario here is not a powerful typhoon making landfall — it is frontal rainfall enhanced by tropical moisture inflow. The rainfall forecast and any track shifts in the tropical depression deserve close attention as the weekend approaches.
Published by Ed Vallee
This piece discusses the month of June in a historical context with respect to pop weighted CDDs and how 2026 stacks up against other years dating back to 1960.
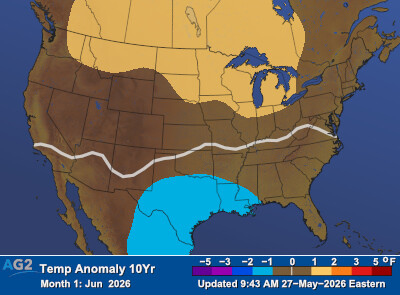
To start, let’s get a quick look at how the month of June is likely to start out – it will start out warmer than normal for the northern tier with “coolest” risks in the South and East.
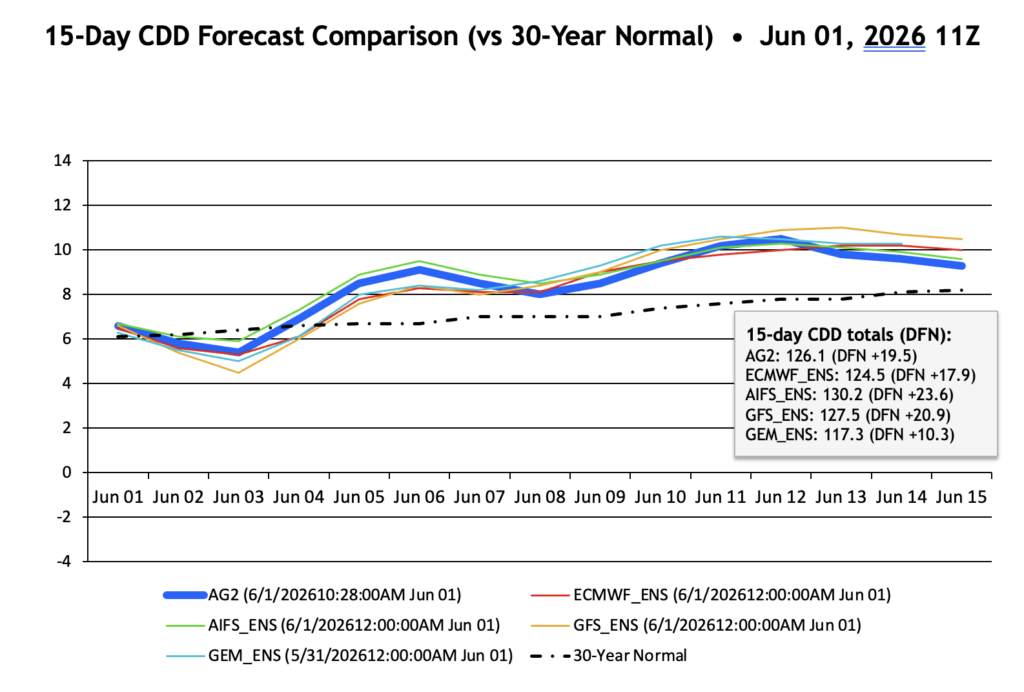
With our 15 day forecast covering much of the front half of the month, the June 1-15 forecast yields 126.1 CDDs, 19.5 CDDs above the 30 year normal for that same period. The 16-30 day likely will feature a CDD regime near 10 and 30 year normals given the warmth settling in the West. Our official current June CDD value is 274.
Our June 2026 CDD forecast stands at 274 CDDs. This would be the 9th warmest since 1960. 2025 yielded 276 CDDs. Notice Texas is coolest relative to the 2016-2025 rolling 10 year normals.
Based on observations since 1960, we can see our 2026 forecast of 274 CDDs would be good for the 9th warmest June.
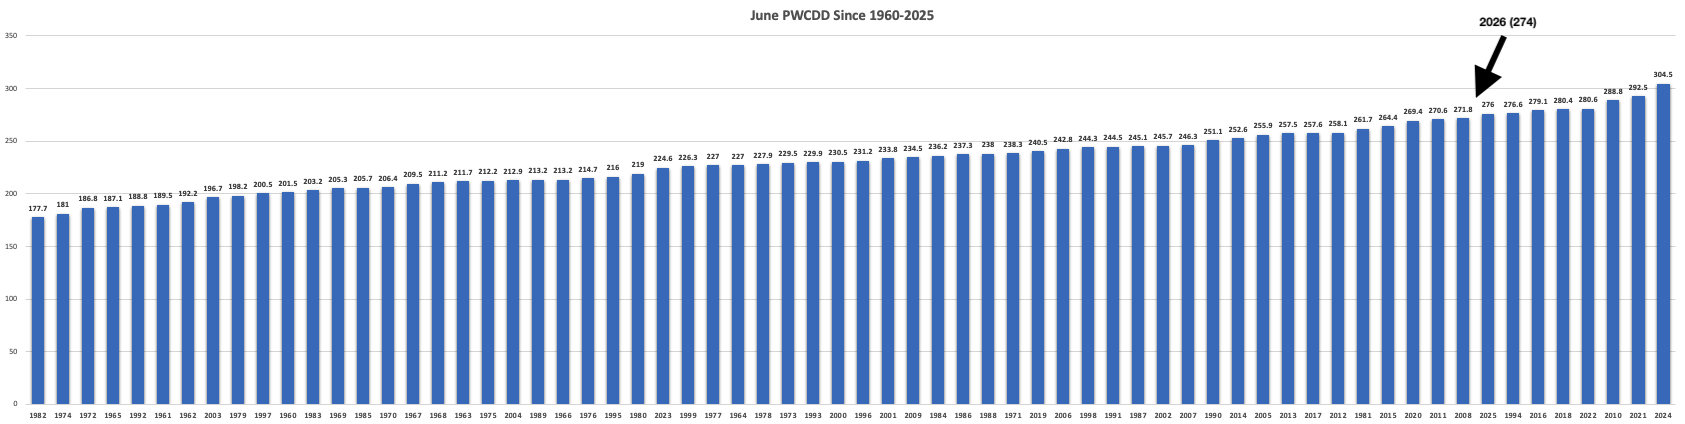
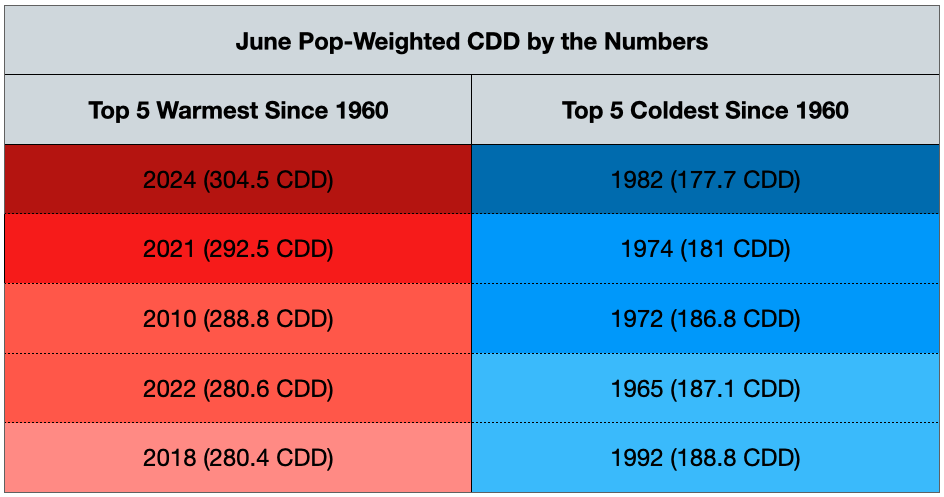
By the numbers, we can see that our current projection of 274 CDD is not in the top 5 coldest or warmest June’s since 1960, but we are not far off from the 5th warmest spot…
Bottom line: a warmer than normal June is expected in terms of pop-weighted CDDs, falling above the 10 and 30 year normals, with warmest risks generally focused in the north-central U.S.
Published by Takahisa Nishikawa
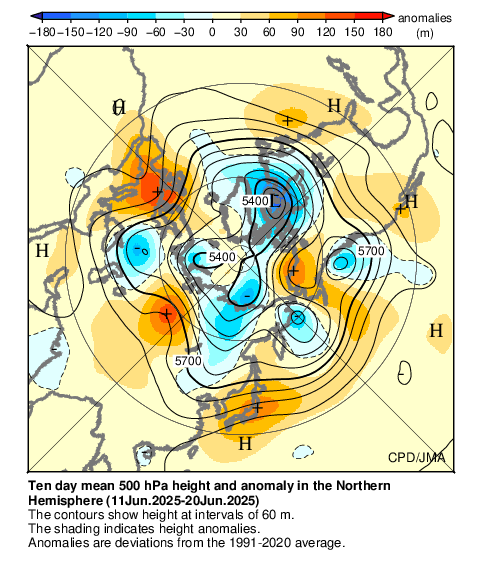
Summary Analysis of weekly 500 hPa geopotential height forecasts suggests that the rainy season onset across much of Honshu may arrive slightly later than normal this year. By contrast, the end of the rainy season in southern Kyushu could come slightly earlier than normal. This stands in sharp contrast to last year’s exceptionally early rainy season, which concluded across most of the country — except Tohoku — by the end of June.
Background: Normal Timing and Last Year’s Contrast
The rainy season typically begins across most of Honshu between early and mid-June, with the end arriving between mid- and late July. Last year was a notable exception — the rainy season onset was exceptionally early across most regions (excluding Tohoku), and the end of the rainy season was similarly advanced, wrapping up by late June almost everywhere outside of Tohoku. This year’s pattern looks set to be quite different.

Methodology: Reading the Baiu Front and Pacific High From 500 hPa Heights
A well-established framework links the 500 hPa geopotential height field to the rainy season pattern: the Baiu front typically corresponds to the 5820 m contour, while the western Pacific subtropical high is associated with the 5880 m contour. The following analysis uses weekly 500 hPa GPH anomaly forecasts to assess the likely timing of rainy season onset and end by region.
Week 2 (June 8–15): Southern Kyushu May See Rainy Season Onset
The 5820 m contour is forecast to sit over southern Kyushu during this period, but does not extend to other regions. The 5880 m contour remains south of Okinawa. The rainy season onset looks possible for southern Kyushu during this window, but most of Honshu remains too early.
Week 3 (June 15–22): Rainy Season Onset Likely for Much of Honshu

The 5820 m contour advances northward to cover northern Kyushu, Shikoku, southern Kansai, Tokai, and Kanto. The 5880 m contour moves to near Okinawa. The rainy season onset is possible across northern Kyushu, Shikoku, Kansai, Tokai, and Kanto during this period. Okinawa may also see the end of its rainy season around this time.
Week 4 (June 22–29): Front Reaches Tohoku; Amami May See Rainy Season End

The 5820 m contour continues northward to southern Tohoku, while the 5880 m contour nudges slightly north of Okinawa. The rainy season onset is possible across the Chugoku region, Hokuriku, and Tohoku by the end of this period. The Amami Islands may also see the end of their rainy season around this time.
Week 5 (June 29 – July 5): Southern Kyushu May See Rainy Season End
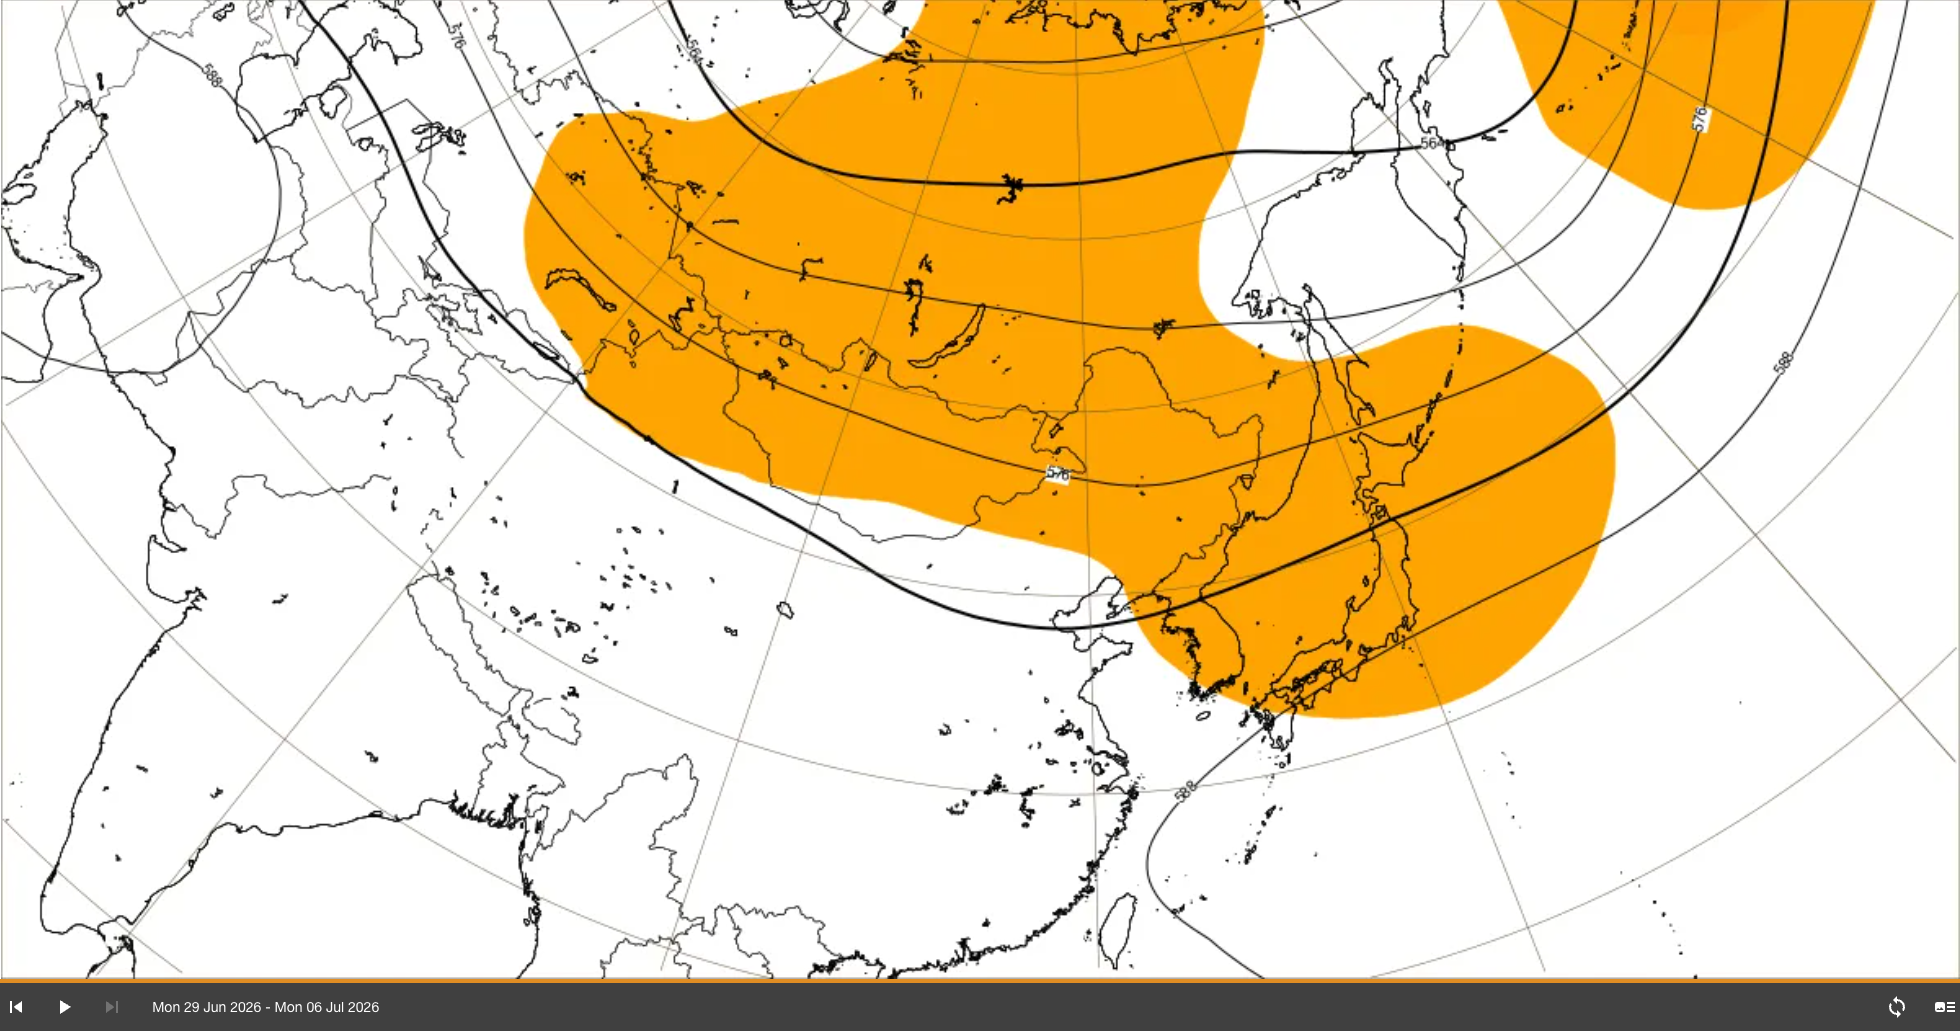
The 5820 m contour advances to northern Tohoku, and the 5880 m contour moves northward to southern Kyushu. This suggests the end of the rainy season in southern Kyushu could arrive during this window. Note that Week 5 forecasts carry significant uncertainty and should be treated as indicative rather than definitive.
Bottom line: Taken together, the 500 hPa height analysis points to a rainy season onset that is slightly later than normal across much of Japan this year, while the end of the rainy season in southern Kyushu may arrive slightly earlier than normal. Week 5 uncertainty limits confidence at that range, but the overall picture contrasts clearly with last year’s exceptionally early rainy season. Further updates will be provided as the sub-seasonal forecast evolves.
Published by Takahisa Nishikawa
Summary The IMD’s May 15 press release placed the monsoon onset over Kerala at May 26 ± 4 days, but current conditions and the near-term forecast pattern suggest a slight delay is possible. The Northern Limit of Monsoon line has stalled near the Andaman & Nicobar Islands over the past few days, and the 850 hPa Zonal Wind Anomaly map indicates that sufficiently moist low-level westerlies are unlikely to reach the Kerala area through the end of May. From June onward, strengthening low-level westerlies should bring the onset back within the normal range. With El Niño expected to suppress convective activity and push total monsoon rainfall below normal this year, an early onset — or at least one that doesn’t slip too far — is particularly important for limiting the dry season risk.
Northern Limit of Monsoon: Progress Has Stalled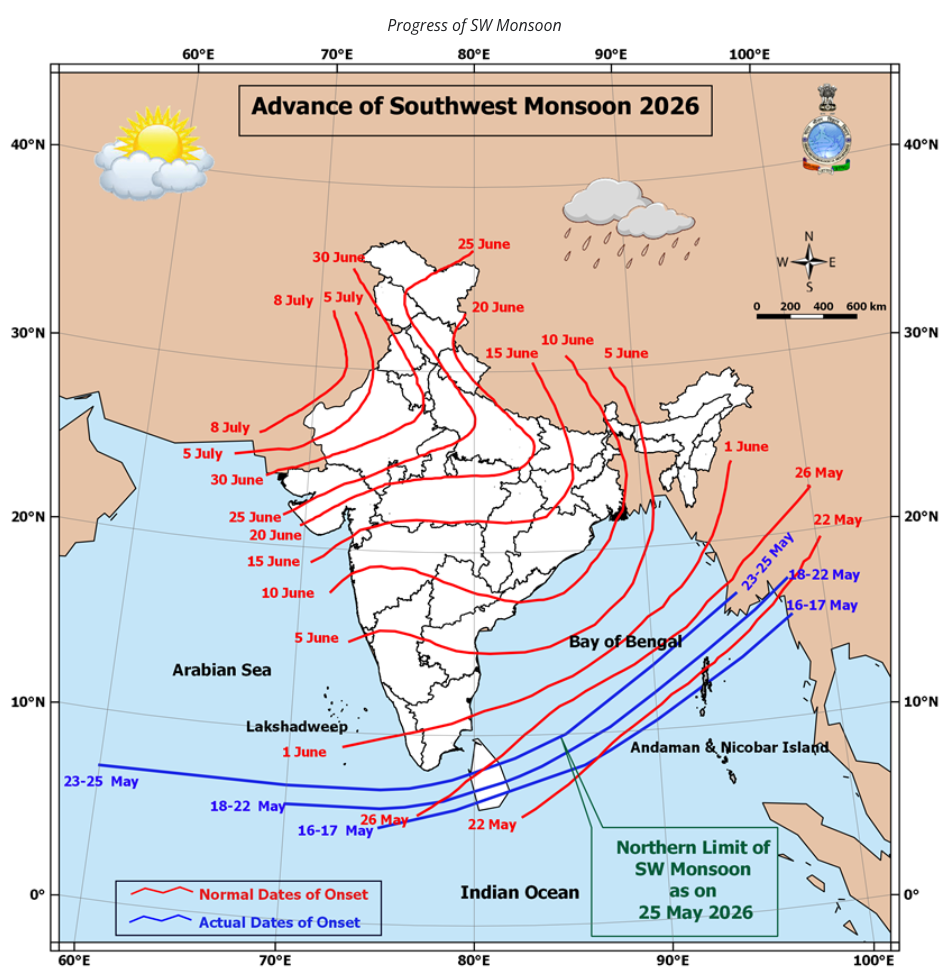
The latest monsoon onset map for India shows the Northern Limit of Monsoon (NLM) line covering the Andaman & Nicobar Islands, but forward progress has effectively stalled over the past few days.
The IMD’s May 15 press release forecast the monsoon onset over Kerala for May 26 ± 4 days. Based on current weather maps and near-term guidance, however, a slight delay beyond that window cannot be ruled out.
Why the Delay? Low-Level Westerlies Are Tracking Too Far South
Precipitation forecasts out to ten days show a drier-than-normal tendency over Kerala and southern India. One key factor is that the low-level zonal wind flow is meandering slightly southward over southern India, limiting the delivery of sufficient moisture to the Kerala region.
The 850 hPa Zonal Wind Anomaly map supports this assessment, indicating that the moist low-level westerlies needed for a monsoon onset are unlikely to reach the Kerala area in meaningful strength through the end of May.
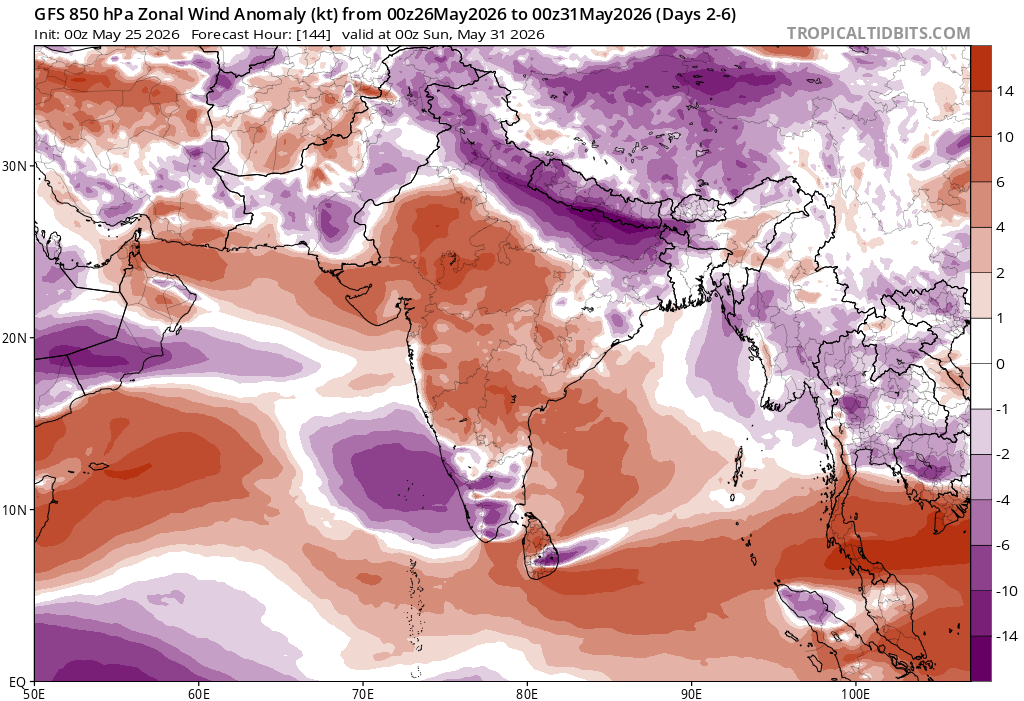
From June: Westerlies Strengthen, Onset Expected Within Normal Range
From June onward, low-level westerlies are expected to strengthen, bringing the monsoon onset back within the climatologically normal range. The current delay appears likely to be temporary, but continued monitoring of model updates will be important as the situation evolves.

El Niño Influence: Below-Normal Rainfall Risk This Season
El Niño is expected to suppress convective activity across India this year, with total monsoon season rainfall forecast to run below normal. In this context, the timing of the onset matters more than usual — every day the monsoon arrives earlier helps reduce the cumulative rainfall deficit for the season. The onset date will be closely watched by agricultural, water resource, and energy sector stakeholders alike.

Published by Takahisa Nishikawa
Summary The next 15 days split into two distinct risk periods: multiple low-pressure systems through late May, followed by tropical storm risk from June 2 onward. Track and intensity uncertainty for the potential tropical system is extremely high, but some models suggest a possible approach toward the Kanto region in early June. On the sub-seasonal scale, a ridge-dominant pattern near Japan is expected from early June through early July, keeping temperatures near to slightly above normal. The rainy season onset looks on schedule or slightly early, with an earlier-than-normal end to the rainy season possible for eastern Japan.
First Half (Through May 29): Multiple Low-Pressure Systems
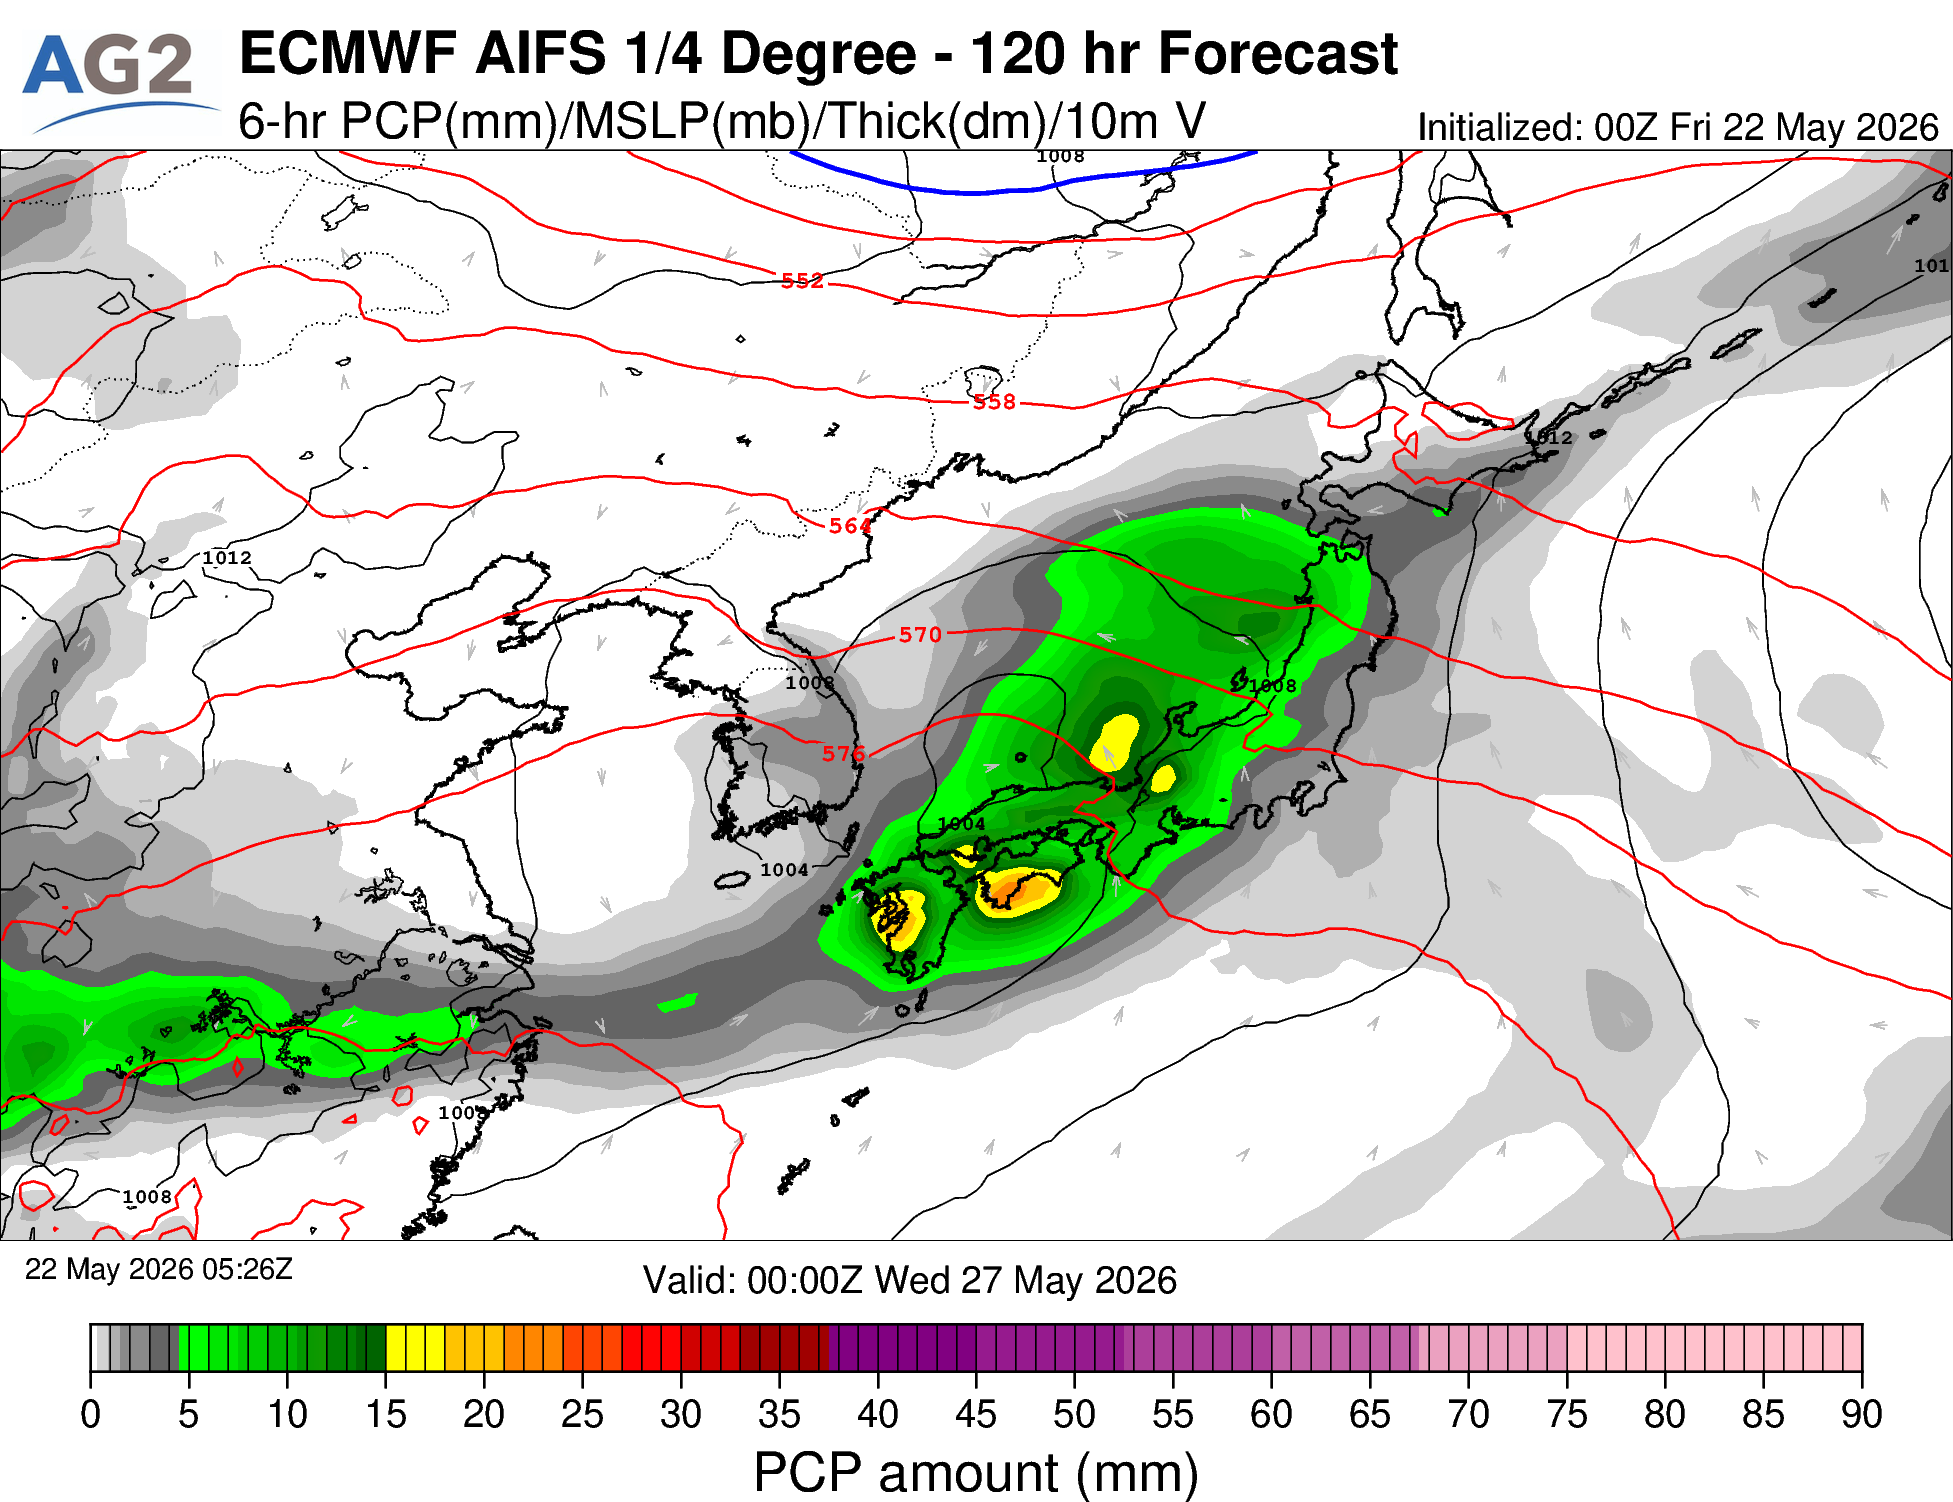
The low that brought cloudy and rainy conditions through today has moved off to the east. A new low developing over the waters south of Japan is expected to pass along the southern coast on May 23–24, raising the risk of below-forecast solar output on the Pacific side of eastern and western Japan.
May 25 brings a brief respite, with a mobile high bringing broadly clear skies across Japan.
From May 26, however, a new low approaching from the Chinese mainland will bring cloudy and rainy conditions to western Japan on May 27, spreading to eastern and northern Japan from May 28.
From May 29, a deepening low tracking east across the northern Sea of Japan will bring strong winds, particularly for eastern Japan, with widespread cloud and rain across northern Japan on the same day. May 30–31 and June 1 see high pressure return, with broadly clear and settled conditions expected across Japan.
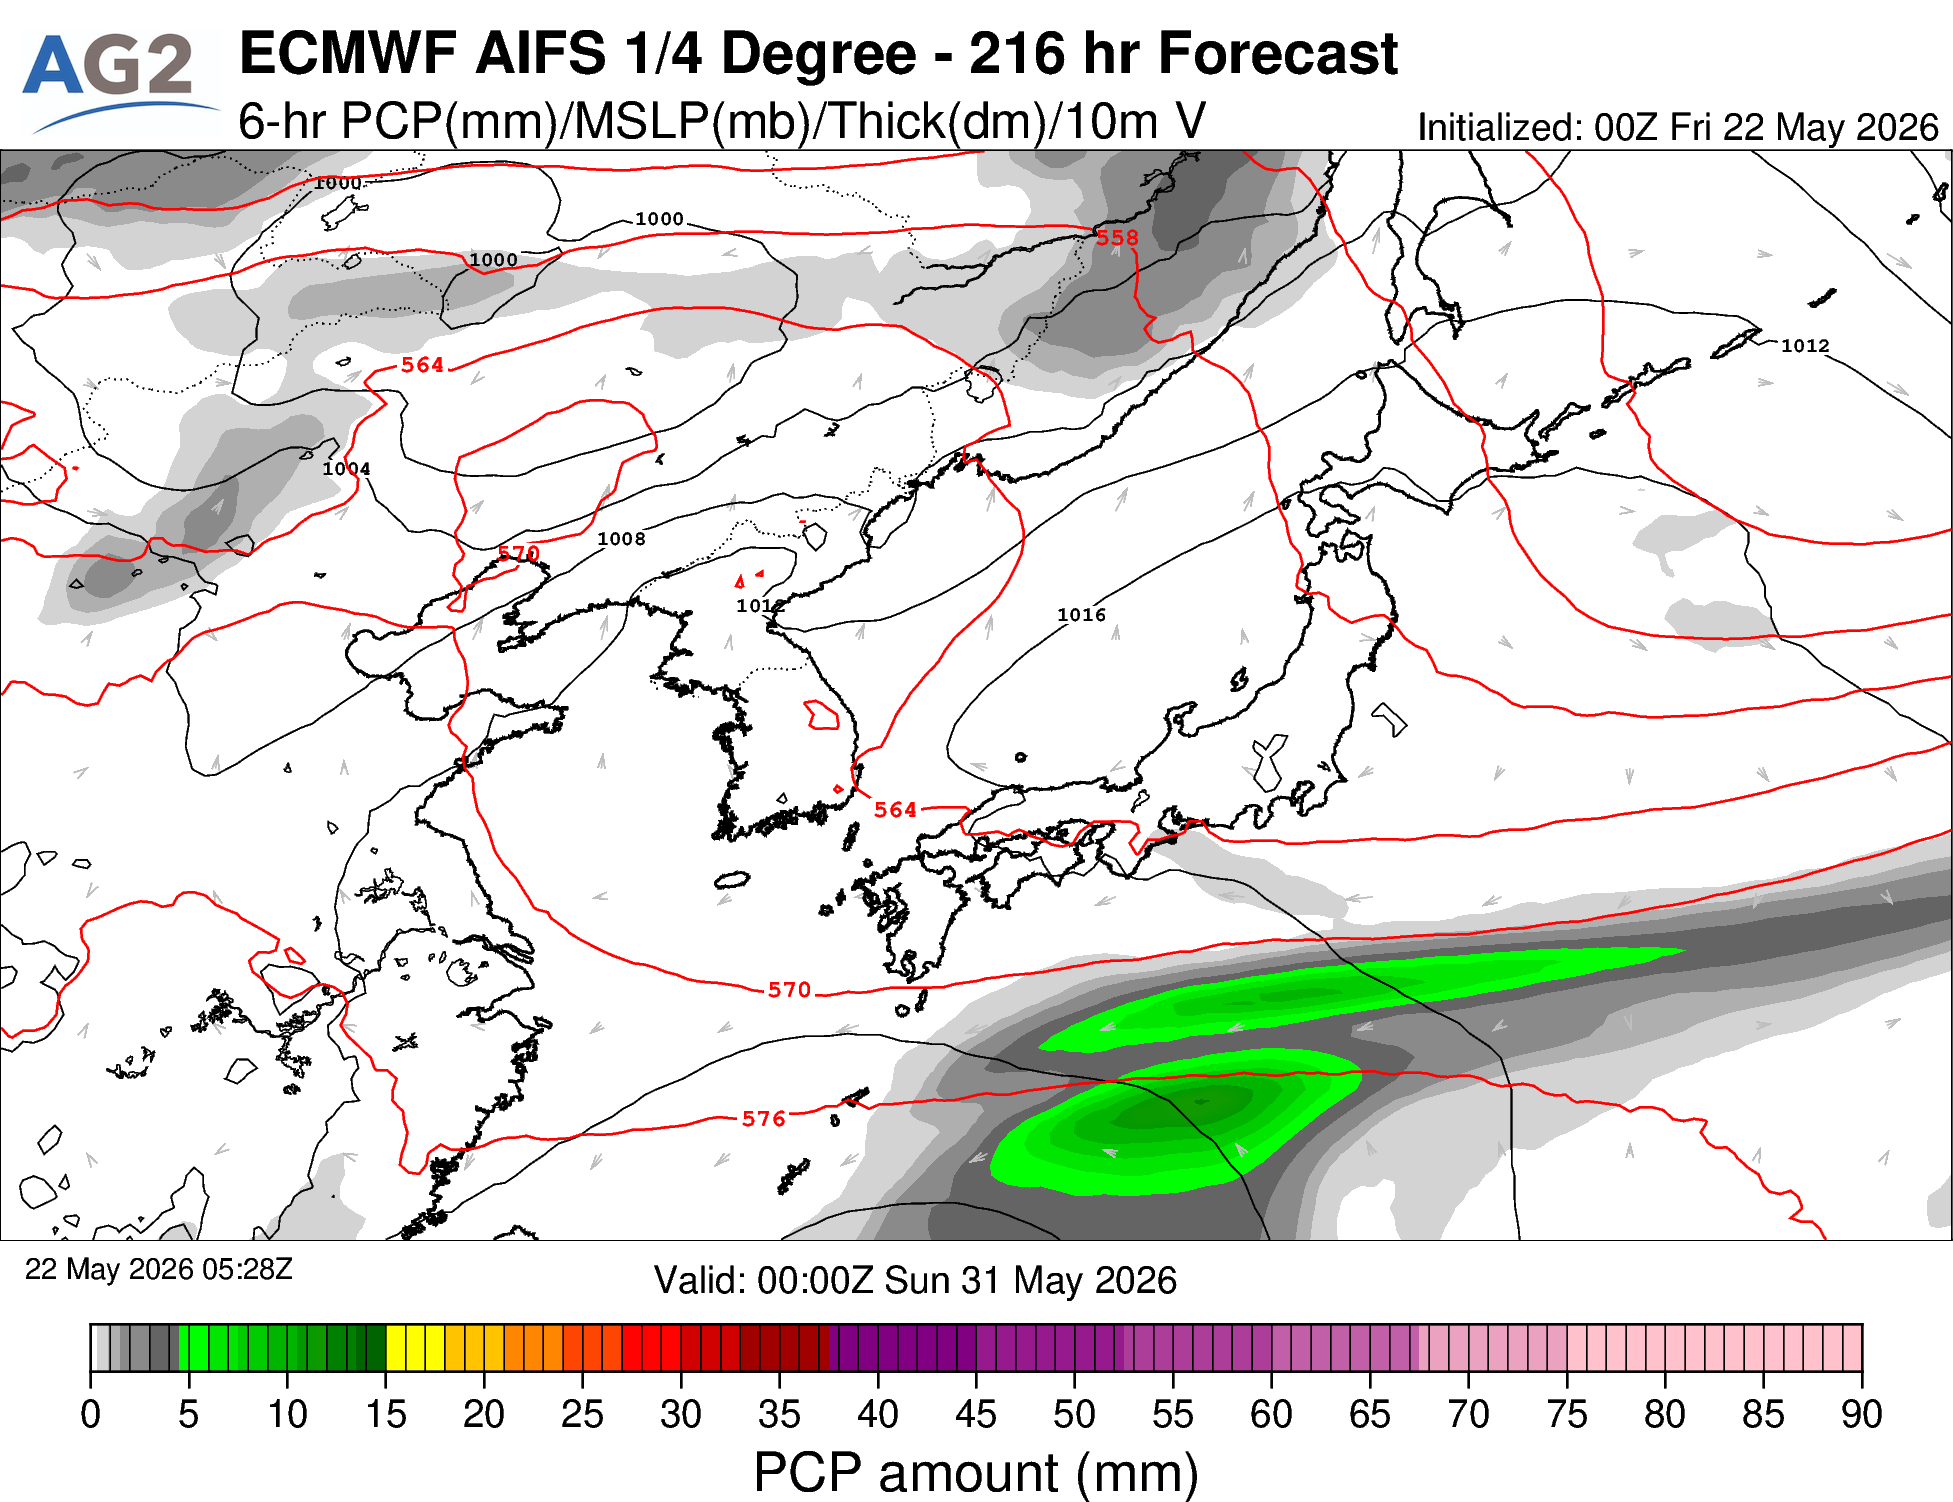
Second Half (From June 2): Tropical Storm Risk Emerges
No tropical storms are currently being monitored by the JTWC. However, from late May, several global models are suggesting the possibility of tropical cyclone development east of the Philippines. Track and intensity uncertainty is extremely high, but some models point to a possible approach toward the Kanto region in early June. Updates will be provided frequently as the situation develops.

Temperature
Temperatures in eastern Japan will run slightly below normal through May 24, before recovering to near- or slightly above-normal from May 25 onward. May 25 stands out as a potential midsummer-like day, with parts of the Kansai region possibly reaching 30°C under the influence of the high. The above-normal temperature tendency is expected to continue thereafter, though tropical storm uncertainty introduces meaningful variability risk to the temperature outlook from June onward.
Precipitation

Above-normal precipitation is expected across northern and eastern Japan through the period, with slightly above-normal totals also possible along the coast of western Japan. While no extreme dry risk is apparent, a low-pressure system around May 27 carries the risk of heavy rainfall in Kyushu. Precipitation forecasts for the latter half of the period are highly sensitive to the tropical storm track.
Solar
Solar output will be disrupted at times during the first half of the period due to frequent low-pressure passages, but May 25, 30, and 31 stand out as favorable days under high-pressure influence. Output looks modestly above normal from June 1, but remains highly sensitive to the tropical storm track.
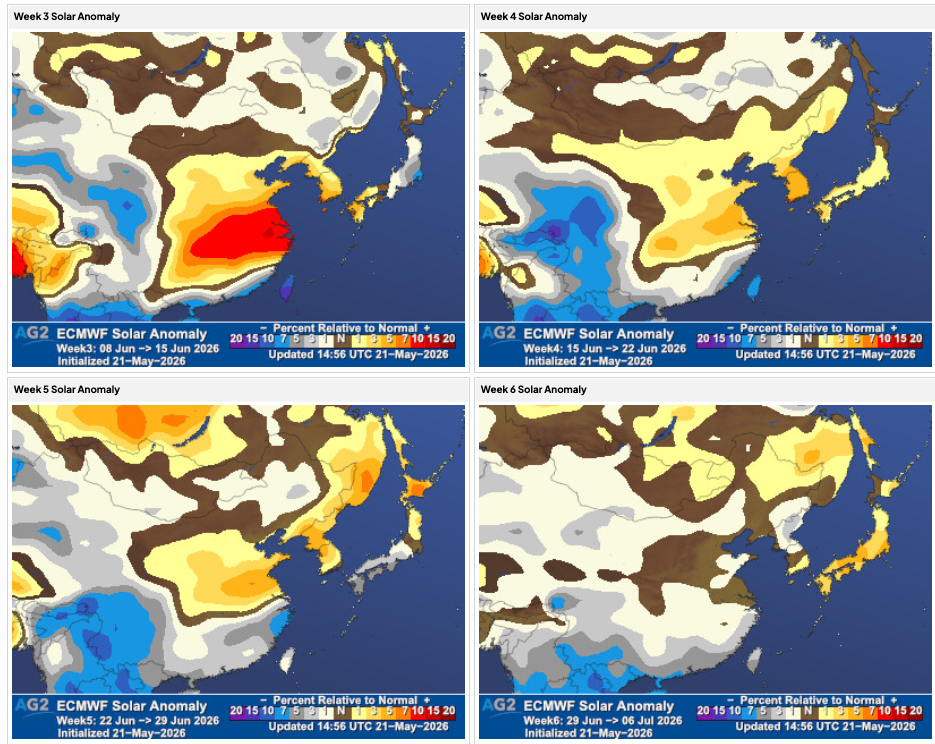
Sub-Seasonal Outlook (Early June Through Early July)
A ridge-dominant pattern is expected near Japan from early June through early July, with positive height anomalies centered on eastern and northern Japan. A trough is consistently forecast near northern China and the Korean Peninsula through this period. Temperatures are expected to run near to slightly above normal, with medium confidence in this outlook.

A low-pressure anomaly is expected through mid-June, bringing slightly above-normal precipitation in the first half of June. From Week 4 onward, a high-pressure anomaly begins to emerge over eastern Japan, shifting eastern Japan toward near- to slightly below-normal precipitation, while western Japan remains prone to above-normal rainfall from moist southerly flow around the ridge.

Solar output will be slightly below normal for eastern Japan in the first half of the sub-seasonal period, shifting to below normal for western Japan around Week 5 (late June). In Week 6 (late June through early July), a scenario where high pressure covers all of Japan emerges, which could bring a favorable period for solar power generation.
The rainy season onset is expected near normal or slightly early. The end of the rainy season in eastern Japan may also arrive slightly ahead of schedule.
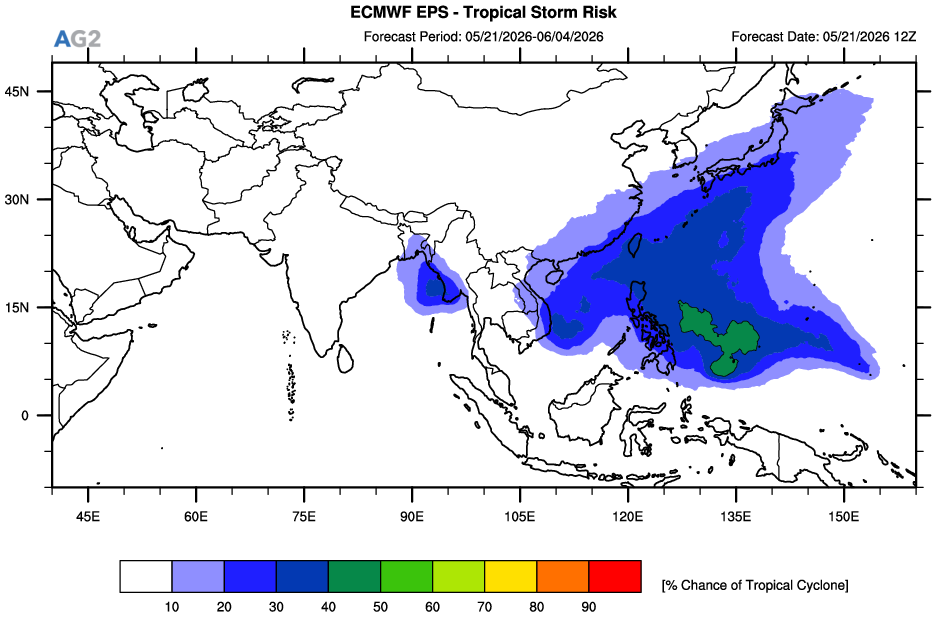
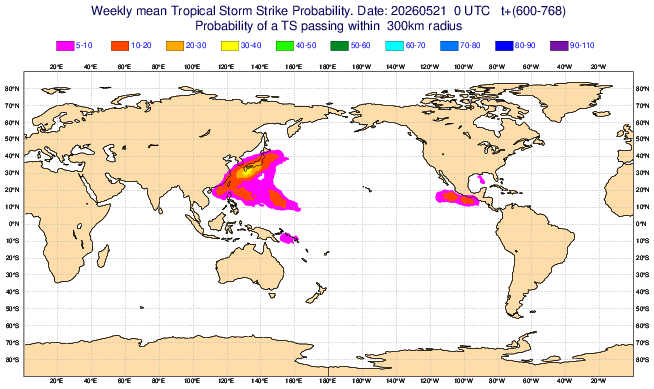
Tropical Storm Strike Risk
ECMWF Tropical Storm Strike Probability guidance shows elevated approach risk for eastern and western Japan through June. While tropical cyclone formation probability in the Philippine Sea and northwest Pacific from mid-June onward is not particularly high, there is also the possibility of extratropical low-pressure development near Japan. Either way, the guidance points to elevated heavy rainfall risk, and the track of any tropical or low-pressure disturbance warrants close monitoring.

Published by Ed Vallee
The 14 day national demand change since yesterday is +1.2 CDDs…
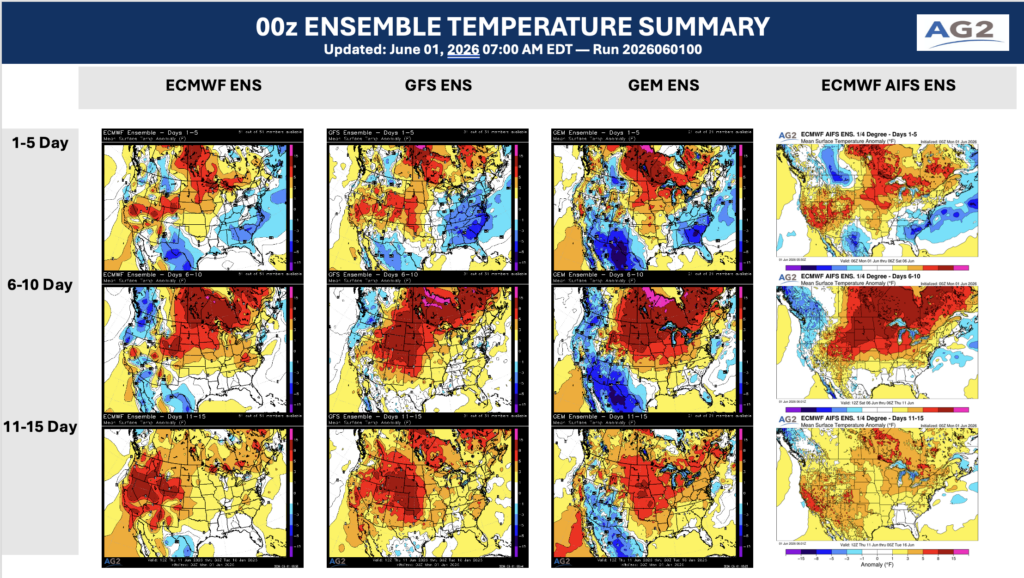
Modeled temperatures next 15 days:
Our forecast in terms CDDs with changes since yesterday:
Degree day info, noting we continue to be on the warmer side of guidance throughout the period.

Looking at day 15, June 2nd, ridging remains focused across the northern tier, but extreme heat is hard to come by: lots of 80s across MISO and PJM.
The 15 day precipitation forecast is starting to resemble El Nino, with precipitation focused across the southern tier, including Texas:
Published by Takahisa Nishikawa
This article summarizes the factors behind the cool conditions in late May last year, the warming trend from mid-June onward, and the outlook through the end of June this year.
In summary, we currently assess the risk of a significant cool spell in late May this year, similar to last year, as relatively low. On the other hand, for the latter half of June, while a prolonged period of strong heat like last year is not the base-case scenario at this stage, short-lived heat events may still require attention depending on the timing of any break in the rainy season.
Late May to Early June
Last year: Cool conditions in late May due to the influence of a trough and frequent rainfall
The main reason for the cool conditions in late May last year was that an upper-level trough, or a low-pressure trough, tended to remain near Japan, allowing cold air to flow into the region.
In particular, the 500 hPa height field showed that western Japan was prone to the influence of the trough. In the lower levels, moist air also flowed in easily, and the rainy season began early, leading to above-normal precipitation in late May.
As a result, the combined effects of cold air, frequent rainfall, and reduced sunshine made it difficult for temperatures to rise, leading to below-normal temperatures.
This year: A dominant ridge pattern makes a sustained cool spell like last year unlikely
By contrast, for late May to early June this year, the current forecasts have been relatively consistent in indicating a dominant ridge pattern, suggesting a tendency for temperatures to be above normal.
The ECMWF ensemble forecasts do not currently show a clear signal of a long-lasting trough near Japan, as was observed last year.
Therefore, at this stage, we consider the likelihood of a sustained period of significantly below-normal temperatures, similar to last year, to be low. That said, there may still be short periods when temperatures are near normal or slightly below normal.
Late June
Last year: Heat in late June driven by a ridge pattern and surface high pressure
From mid- to late June last year, a ridge pattern, or anticyclonic pattern, persisted in the upper levels near Japan.
In addition, surface high pressure frequently covered the region, creating conditions that were unusually favorable for temperatures to rise during the rainy season. As a result, Japan was covered by very warm air, leading to intense heat from mid- to late June.
This heat event was one of the key characteristics of last June.
This year: A ridge as strong as last year is unlikely at this stage, but short-lived heat events remain possible
For the latter half of June this year, current forecasts do not indicate a ridge pattern as strong as the one observed last year.
Therefore, a prolonged period of extreme heat similar to last June is not considered highly likely as the base-case scenario at this point.
However, if a break in the rainy season allows high pressure to cover Japan while the upper-level ridge strengthens at the same time, there is still a meaningful possibility that heat comparable to last year could persist for around two to three days.
Summary
Taking these points together, we currently assess that a sustained cool period similar to last year is unlikely from late May to early June this year. For the latter half of June, however, the main risk to monitor is not necessarily a prolonged extreme heat event, but rather short-lived periods of intense heat.
As the forecast may change with future updates, it will be important to continue monitoring the latest ensemble forecasts and cluster analysis and update the outlook accordingly.
Published by Amy Hodgson
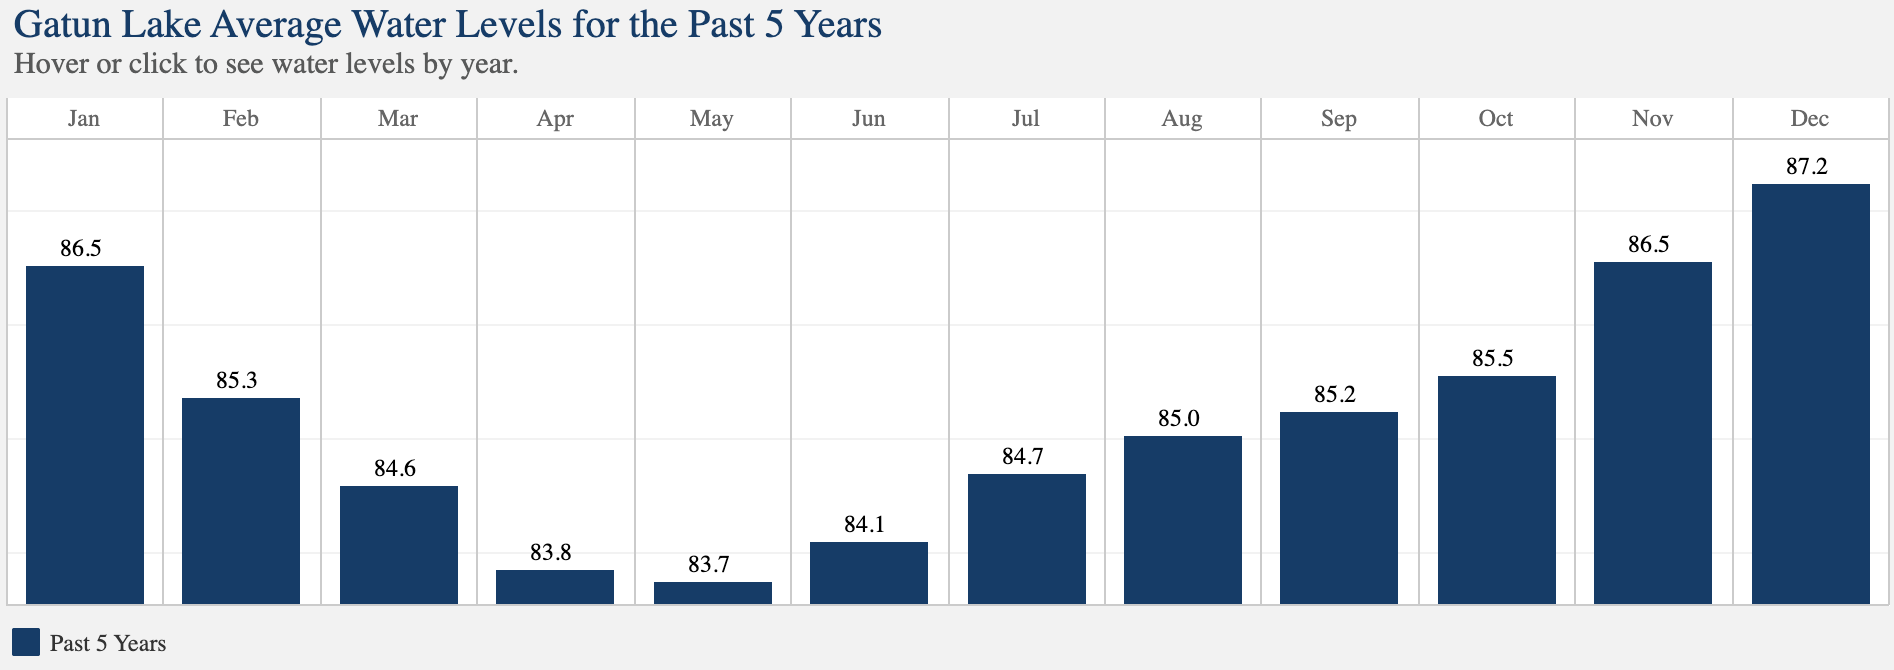
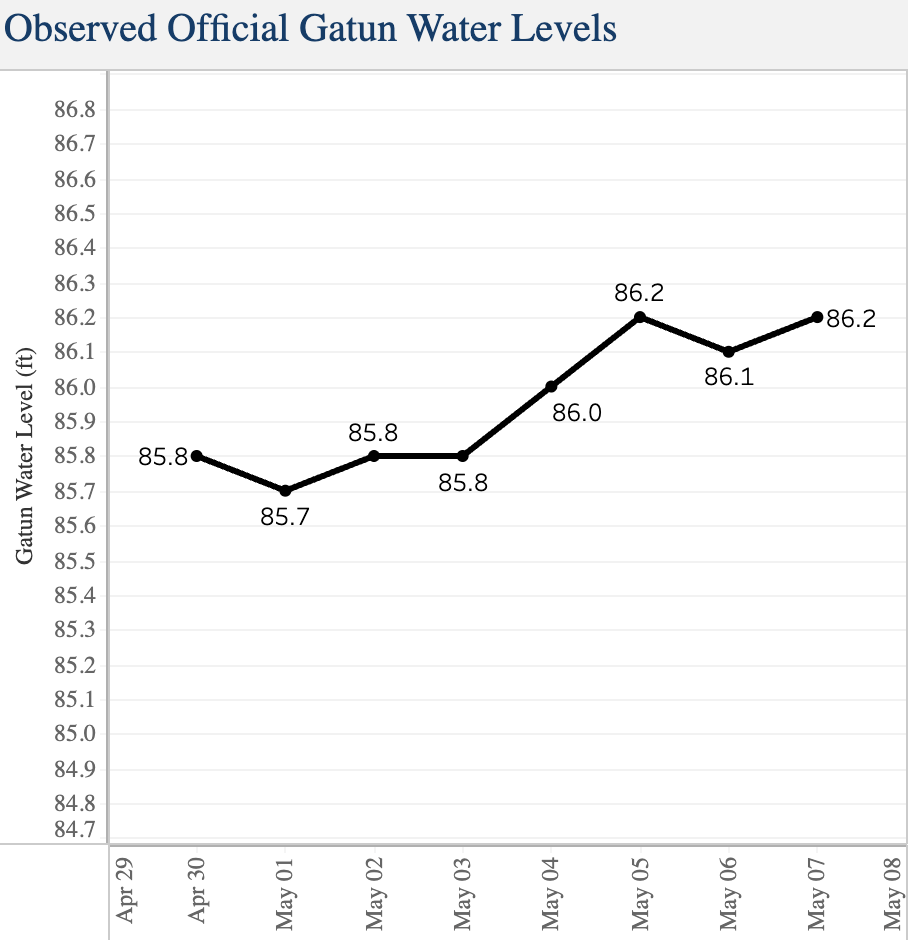
The Panama Canal is a major global shipping route, shortening transit times between the east and west coasts of the Americas. Severe drought in 2023 and into 2024 reduced Panama Canal transits by around 30% as low water levels limited canal operations. The main reservoir feeding the canal is Gatun Lake which has strong seasonal variability. The plot below shows the monthly average water levels over the past five years:
Taking a closer look at the yearly levels for May and August below, clearly shows the extremely low levels during the El Nino of 2023 and to begin 2024.
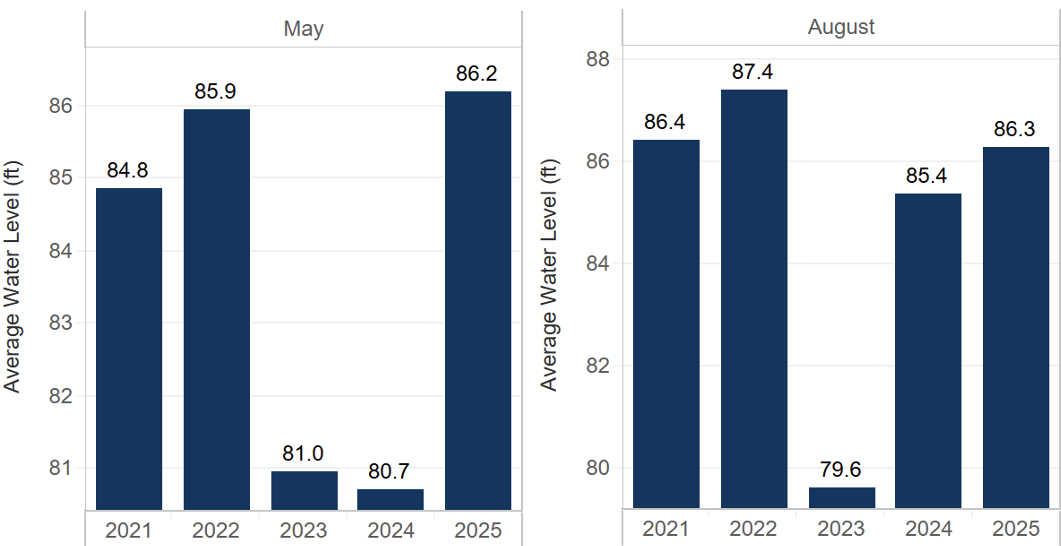
The strong El Nino through 2023-2024 is considered to have played a significant role in these drought conditions leading to the canal operating well below capacity. Daily transits dropped to as low as 24 vessels and maximum drafts fell below 44 feet. By later 2024 and through 2025, a change to La Nina conditions led to an increase in rains across the region and hence the canal returned to normal operations.
So, what is the current situation and the outlook through 2026?
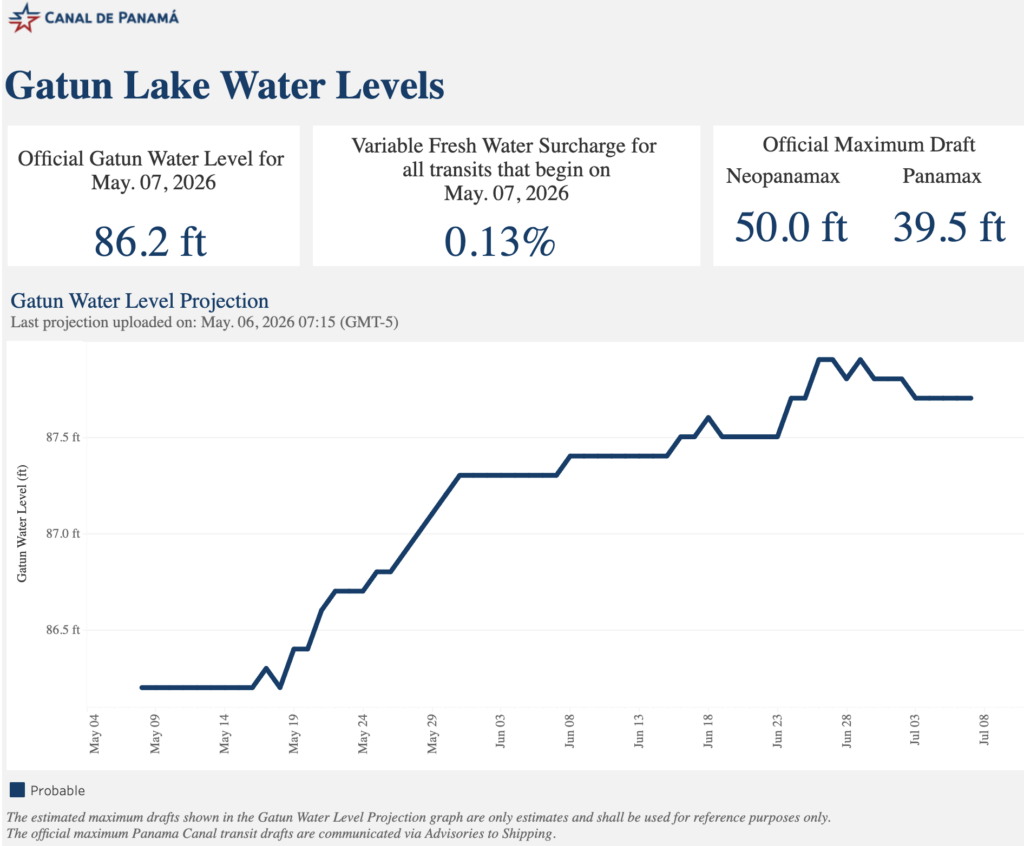
Local observations show water levels in Gatun Lake ranging between 85.7ft to 86.2ft over the past week.
The water level projection plot below does forecast an increase in levels over the next month as expected due to strong precipitation seasonally across the region.
The latest ENSO guidance from the ECMWF below forecasts a strong El Nino developing as we move through the summer and into autumn. A reminder that the 2023-2024 drought occurred during El Nino conditions.
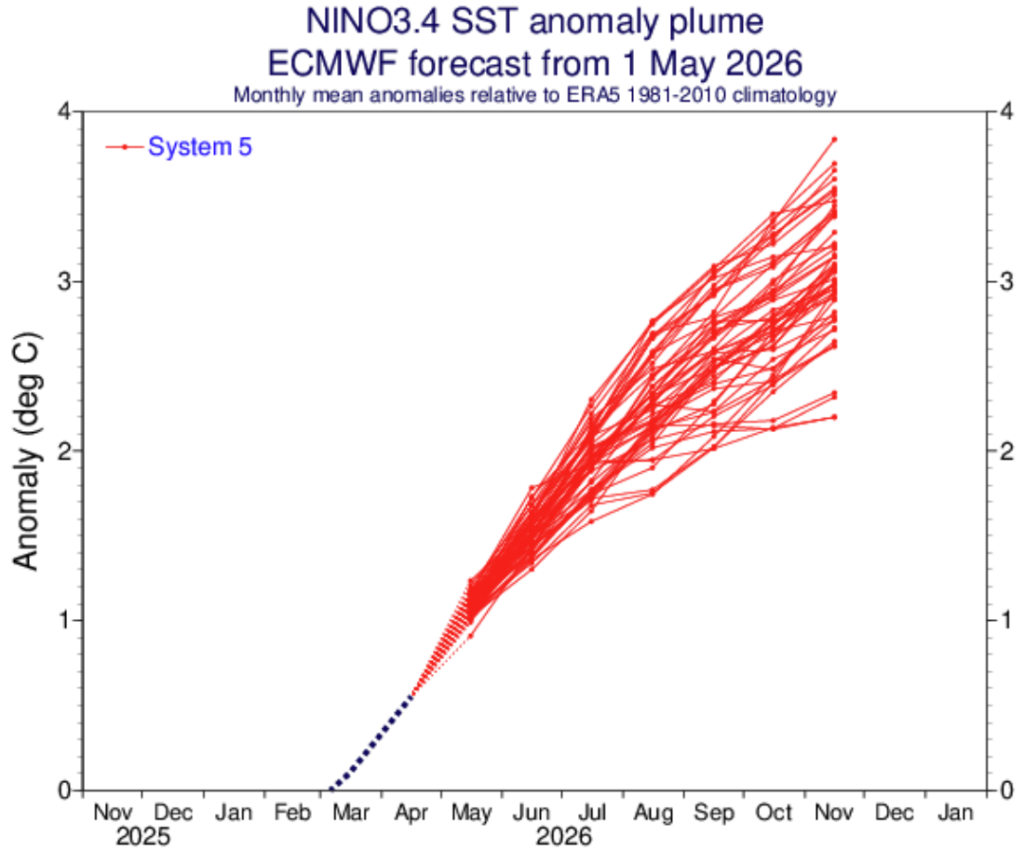
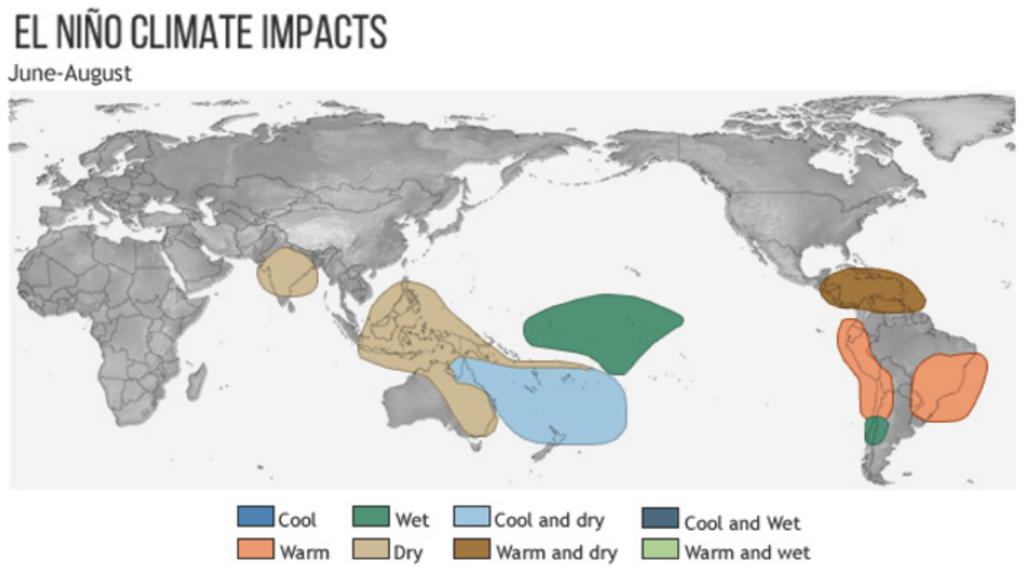
El Nino generally brings drier conditions across the Caribbean, including the Panama Canal region through summer, therefore a close eye needs to be kept on the forecast heading through the year.
The C3S seasonal guidance shows generally shows near normal precipitation amounts in June, before then drier than normal conditions through the rest of summer and into autumn. This would therefore limit precipitation input into Lake Gatun and have implications on water levels in the Panama Canal through the summer and into autumn. There is the increasing risk that this summer could have vessel restrictions if the expected drought conditions come to fruition.

Bottom line: There is the increasing risk of drier than normal conditions returning across the Panama Canal region moving through 2026 as we transition to a possible strong El Nino state. Drier than normal conditions would limit precipitation input into Lake Gatun which is the main reservoir feeding into the canal. This would therefore have a knock on effect on canal levels which if water levels drop low enough, could potentially lead to vessel restrictions moving through the year.
Published by Amy Hodgson
Here we take a look at the latest hydro situation across Brazil, and the precipitation outlook as we move through Spring and into Summer. The previous Brazil hydro blog issued late March can be found here https://www.ag2trader.com/1-15days/?blogPostID=190361
Brazil is one of the largest producers of hydroelectric power in the world, with the largest hydroelectric dam here being the Itaipu Dam. The primary reason for importing LNG into Brazil is to make up for the lack of electricity produced by the Itaipu Dam and other dams across Brazil, especially during times of drought. During times of drought, Brazil relies upon import LNG to meet its power needs. Therefore it’s crucial to monitor Brazilian precipitation.
Over the past 90 days, conditions have been slightly drier than normal across much of Brazil, except nearer normal across the far east. While over the past 30 days, it’s been particularly dry across south-eastern Brazil.

The latest soil moisture data from NASA shows largely dry soils, particularly across the interior regions of Brazil, although there are some localised wetter soils across the north-east:
Now looking at the latest hydropower reservoir levels (https://www.ons.org.br/paginas/energia-agora/reservatorios). Compared to our last update https://www.ag2trader.com/1-15days/?blogPostID=190361, levels have increased across all regions. However, southern regions still remain low.
Now looking ahead to the forecast, the precipitation anomalies from the ECMWF and the GFS over the next 15 days are shown below. Generally a dry outlook continuing across much of Brazil, the exception being wetter across the far south, and across the far north.
The latest ECMWF weekly below shows wetter conditions across the far north of Brazil weeks 21 and 22, with near normal to drier than normal across much of Brazil. Weeks 23 and 24, generally near normal precipitation across much of Brazil.

The C3S seasonal guidance below shows near normal precipitation forecast through the summer across central Brazil, with a generally drier far north and wetter south pattern.
El Nino conditions are forecast as we move through summer, possibly reaching strong levels. El Nino conditions through summer, generally favor a drier Caribbean and into northern Brazil as shown in the graphic below, which is in agreement with the C3S forecast for summer.
Bottom line: Over the past month reservoir levels across Brazil have increased slightly, however levels across the south remain low. The forecast over the 2 weeks is for generally a dry outlook continuing across much of Brazil, the exception being wetter across the far south, and across the far north. Then through the summer, the C3S seasonal guidance shows near normal precipitation forecast across central Brazil, with a generally drier far north and wetter south pattern. This drier north pattern is typical of an El Nino pattern which is forecast as we move through 2026.
Published by Ed Vallee
Changes:
Week 1-3: Cooler West, Warmer Central
Week 4: Cooler Northeast, Warmer Rockies
Week 5: Cooler PNW
CDD Info noting 10 CDDs gained versus yesterday’s forecast.

Published by Ed Vallee
Today’s 12z overview for the next 15 days is shown below.

Degree Day Info:
Published by Takahisa Nishikawa
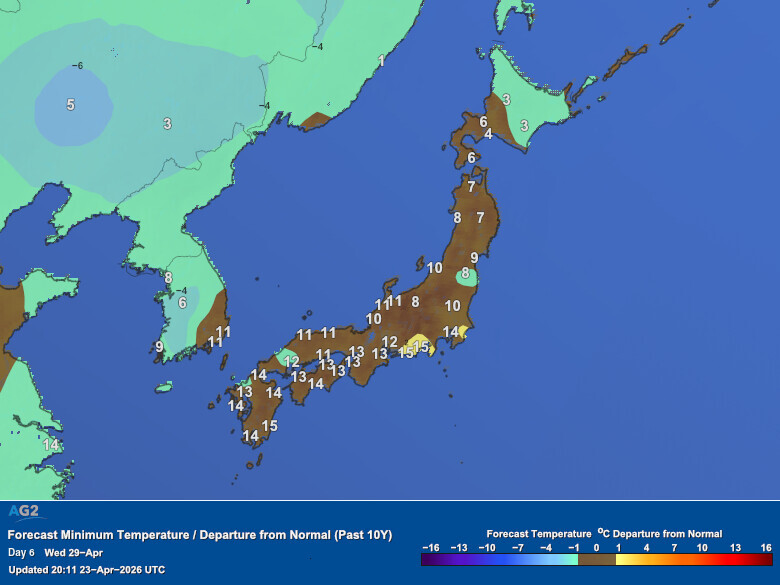
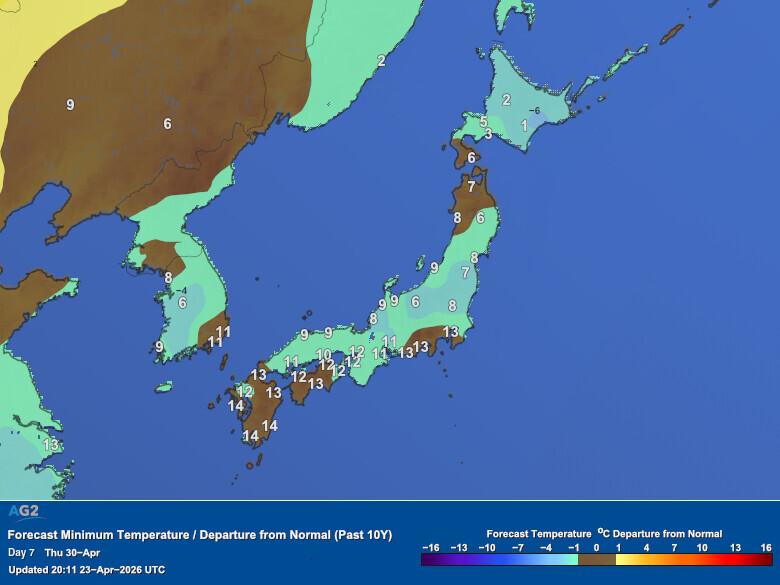
May 1: Cold Air Advection Drives Sharp Temperature Drop
Today’s AG2 forecast brings a meaningful downward revision to temperatures across Japan from April 29 through May 7. The most striking change is in Tokyo, where the daytime high on April 30 has been revised down by 4°C from yesterday’s forecast.

The main driver is cold air advection following a low-pressure system passage. Models are broadly aligned on the depth and position of the associated trough, lending relatively high confidence to this near-term forecast.

From April 29 to May 1, minimum temperatures are expected to fall to single digits across a wide area of northern and eastern Japan. This raises the prospect of an uptick in morning and evening heating demand that warrants attention from power and gas market participants.
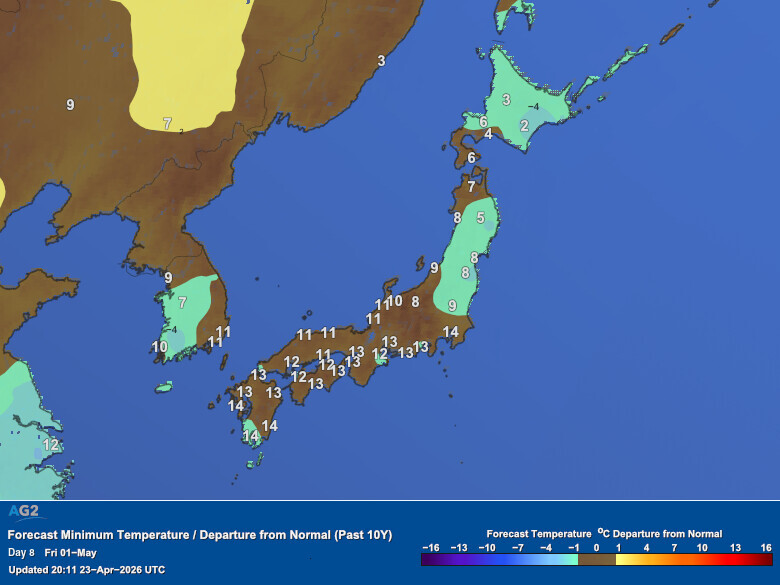
From May 2: Ridge Returns, Temperatures Recover
Will this cold spell last? The answer is no.
From May 2, a ridge pattern is expected to establish itself over Japan, bringing a return to near- to slightly above-normal temperatures.
This cold episode should be seen as a short-term fluctuation rather than a signal of any sustained seasonal shift.
Published by Amy Hodgson
Here we take a look at the large scale atmospheric pattern through days 6-10 and 11-15.
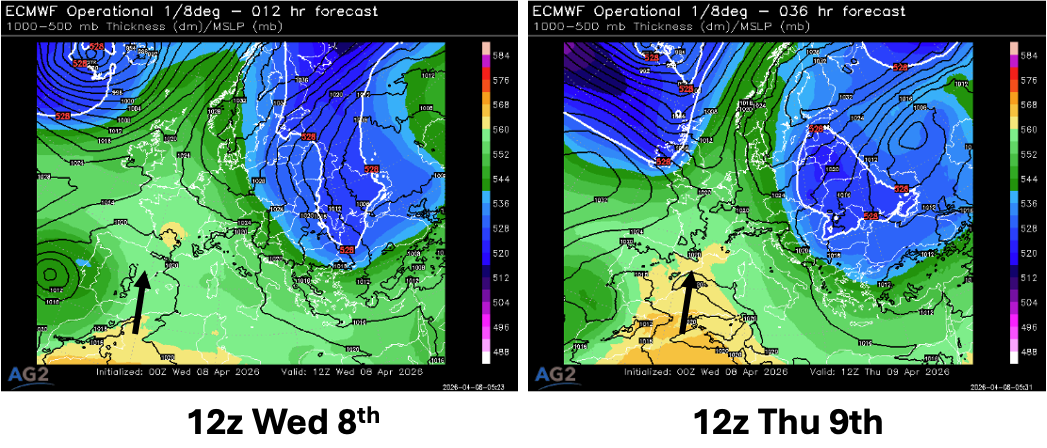
The graphics below show the latest ensembles for mid week 16, Wednesday 15th April. The models are in close agreement of a Nordic high, with higher pressure extending across much of Europe.

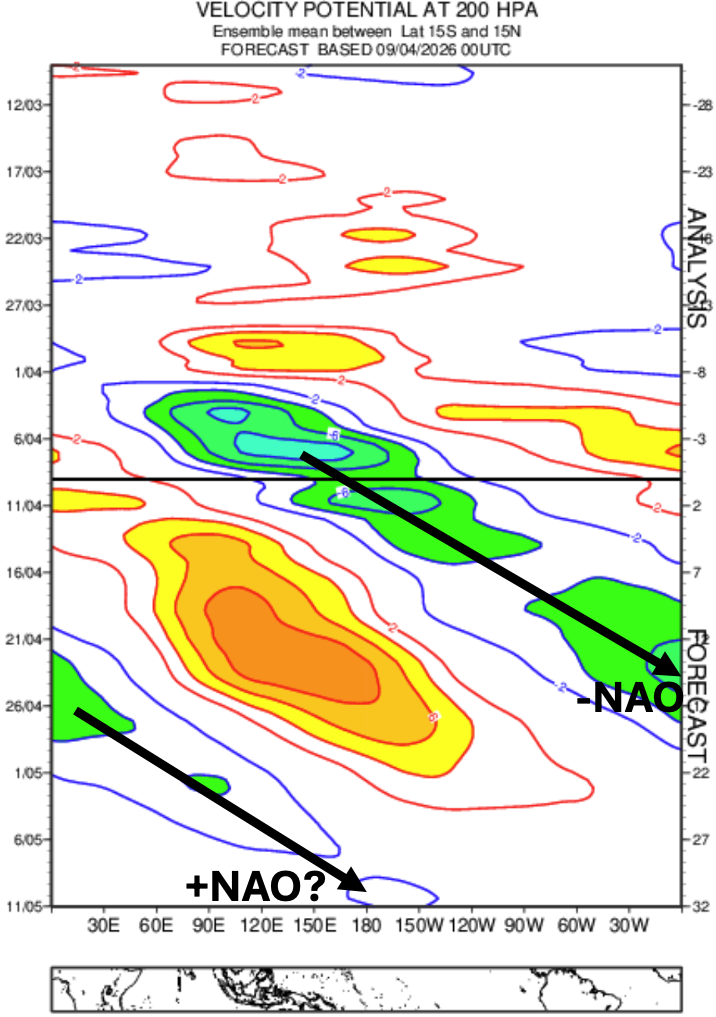
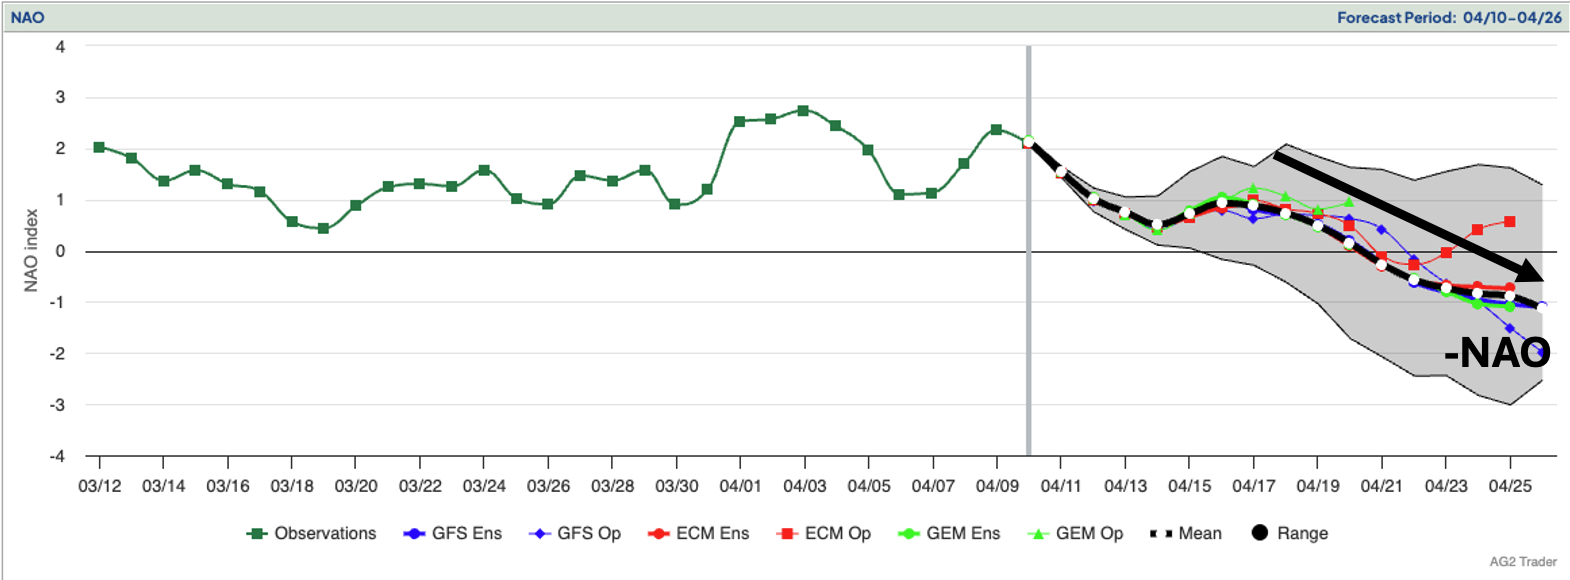
Then by late week 17, the ensembles below show the high retrogressing to Greenland, with the NAO dropping to negative territory. There’s overall good model agreement in the broad pattern trend to a reduction in the NAO index.

This NAO drop late April has been highlighted for a while now, as the MJO moves across the western Hemisphere:
A quick look at the FRisk graphics below actually shows plenty of green across Europe from day 7 onwards indicating lower than normal forecast risk, or that there is higher than normal forecast confidence.

Expectations as the NAO drops to negative week 17?
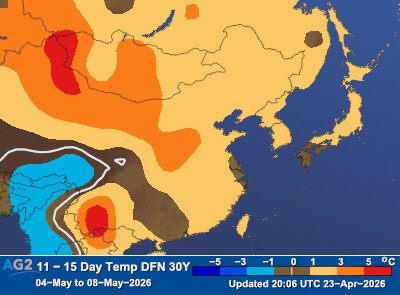
The latest AG2 temperature forecast for the 11-15 day timeframe is shown below with northern-central to north-eastern Europe highlighted as the area where there is greatest cooler risk to the forecast. Conditions are also forecast to be drier than normal across northern and central Europe, with low winds and high solar here. While to the far south of Europe, slightly below normal to near normal precipitation, mostly low winds and below normal solar potential.

Published by Amy Hodgson
Here, we present the latest Saharan dust outlook across Europe through the rest of this week.
With lower pressure in the vicinity of Iberia, this is resulting in a southerly airflow around it’s western flank, transporting Saharan dust northwards across Iberia:
The latest dust load forecast from the University of Athens below shows the highest dust load currently across Iberia to western France. Then by Saturday, elevated levels are forecast across much of western Europe edging into central Europe and across Germany on Sunday which gives the downside risk to solar generation.

The Barcelona Dust Regional Centre dust load forecast below shows a similar pattern of higher levels across Iberia, with lower levels spreading to north-western and central Europe over the next few days.

So why Saharan dust important?
Saharan dust can have an impact on solar power generation both directly and indirectly. Directly, dust in the atmosphere blocks and scatters solar radiation from the sun, hence less incoming radiation hitting solar panels, thereby reducing generation. Dry deposition of the dust directly settling and building up on the panels will also reduce the power generation. Wet deposition, the process of removal of dust from the atmosphere by precipitation can also lead to dust build up on panels and reduced generation. Finally indirectly, Saharan dust in the atmosphere can act as cloud condensation nuclei (CCN), which is needed for clouds to form. Therefore dust in the atmosphere acting as CCN can lead to an increase in cloudiness, thereby reducing incoming solar radiation leading to a reduction in solar generation.
Risks are therefore to the downside for solar across Iberia through the rest of this week, with lower dust levels also reaching across France and then Germany by front weekend.
Published by
Summary: NOAA puts the probability of El Niño this summer above 60%. However, spring forecasts are inherently uncertain. Past cases show that early signals often fail to materialize. Markets may price in El Niño risk, but overconfidence is risky. Treat forecasts as probabilities, not certainties.

Figure 1: ENSO Probabilities by NOAA as of March, 2026
Risks in Spring El Niño Forecasts
NOAA’s latest outlook may have led traders to price in El Niño trend. But building positions based on spring forecasts alone can be risky.
This is due to the “spring predictability barrier,” when forecast skill is structurally lower.
What History Tells Us
2014: Strong signal that failed
- Forecast pointed to a very strong El Niño
- Actual warming was limited
- Strong signals can lead to market overreaction

Figure 2: July SST analysis values (left), forecast (center), and error (right) by JMA with initial values in April 2014
2012: Event declaration reversed
- JMA initially declared an event
- Later revised to no event
- Even “declared” events may not hold

Figure 3: July SST analysis values (left), forecast (center), and error (right) by JMA with initial values in April 2012
Why Spring Forecasts Struggle
From March to May, trade winds and ocean temperatures fluctuate more. This makes initial conditions unstable in models. Forecast skill improves after June as ocean-atmosphere feedback stabilizes.
Trading Implications
1. Keep alternative scenarios
Even if an El Niño is forecast, the underlying warming trend means localized extreme heat cannot be ruled out.
Traders should therefore keep hedges for a “La Niña-like” hot scenario if the forecast fails.
In Japan, this risk is especially important. Under La Niña or neutral conditions, sea surface temperatures east of the Philippines tend to rise. This enhances convection, which strengthens the Pacific High (PJ pattern). As a result, the risk of extreme heat in Japan increases.
In short, even without El Niño, the risk of a hot summer remains significant.
2. Avoid full commitment until forecast convergence in June
Forecast skill tends to improve after June, once the spring predictability barrier passes.
JMA data shows that forecasts issued in April lose accuracy beyond a three-month horizon, while forecasts from June maintain relatively better skill up to six months ahead.
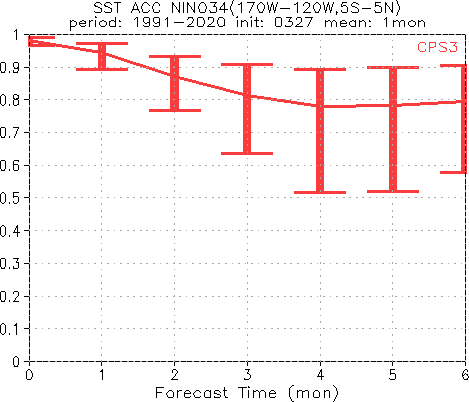
Figure 4: SST accuracy evaluation of the Niño 3.4 area with initial values in April

Figure 5: SST accuracy evaluation of the Niño 3.4 area with initial values in June
This highlights the high uncertainty in spring forecasts.
Until then, it is prudent to keep positions smaller and manage volatility using options or similar tools.
3. Watch the Pacific High directly
Japanese demand depends more on the Pacific High than ENSO itself. Monitoring its strength can help detect forecast errors early.
Bottom line: El Niño forecasts are probabilistic, not certain. History shows that forecasts can fail. Flexible scenario planning remains essential for energy markets.
Published by Ed Vallee
This blog takes a look at the latest drought monitor, which was issued on April 2nd.
The latest drought monitor is below, noting drought coverage is up to 80.01 % (up from 77.14% last week).
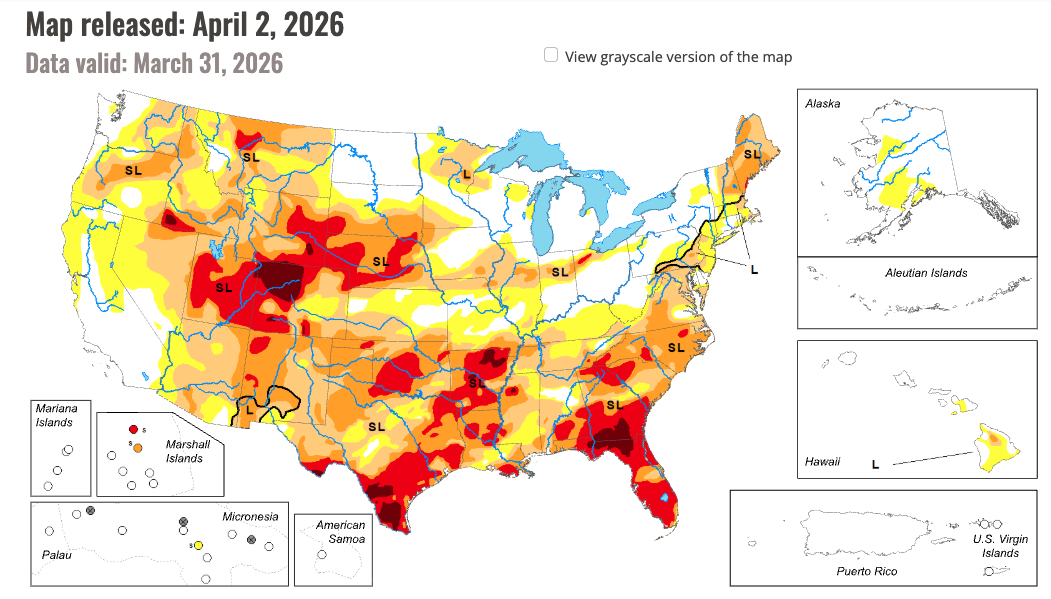
Month over month change maps are below. The most notable trends in the last month are wetter in parts of the Ohio River Valley and Northeast, but drier in parts of the Rockies, Plains, South, and West.

The forecast over the next 15 days is fairly dry across the West and Southeast, but the Central U.S. looks active!
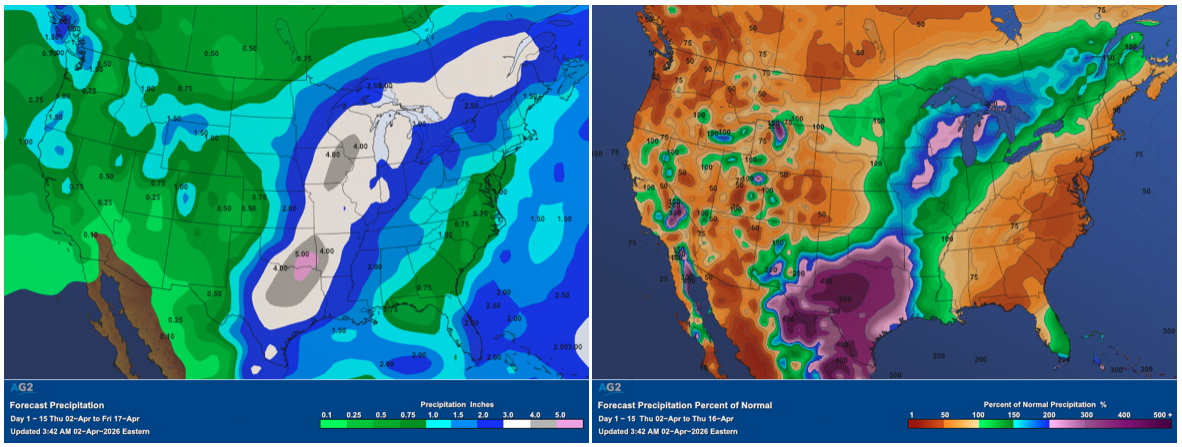
Published by Amy Hodgson
This blog gives an overview of the latest German wind outlook through the end of March and into April.
Through mid this week, a cold plunge will move into northern-central Europe as a result of higher pressure to the west, with lower pressure to the north-east. Alongside the drop in temperatures, a tight pressure gradient across northern mainland Europe will lead to a peak in German winds to high levels on Wed 25th March, reaching mid 40GW levels.
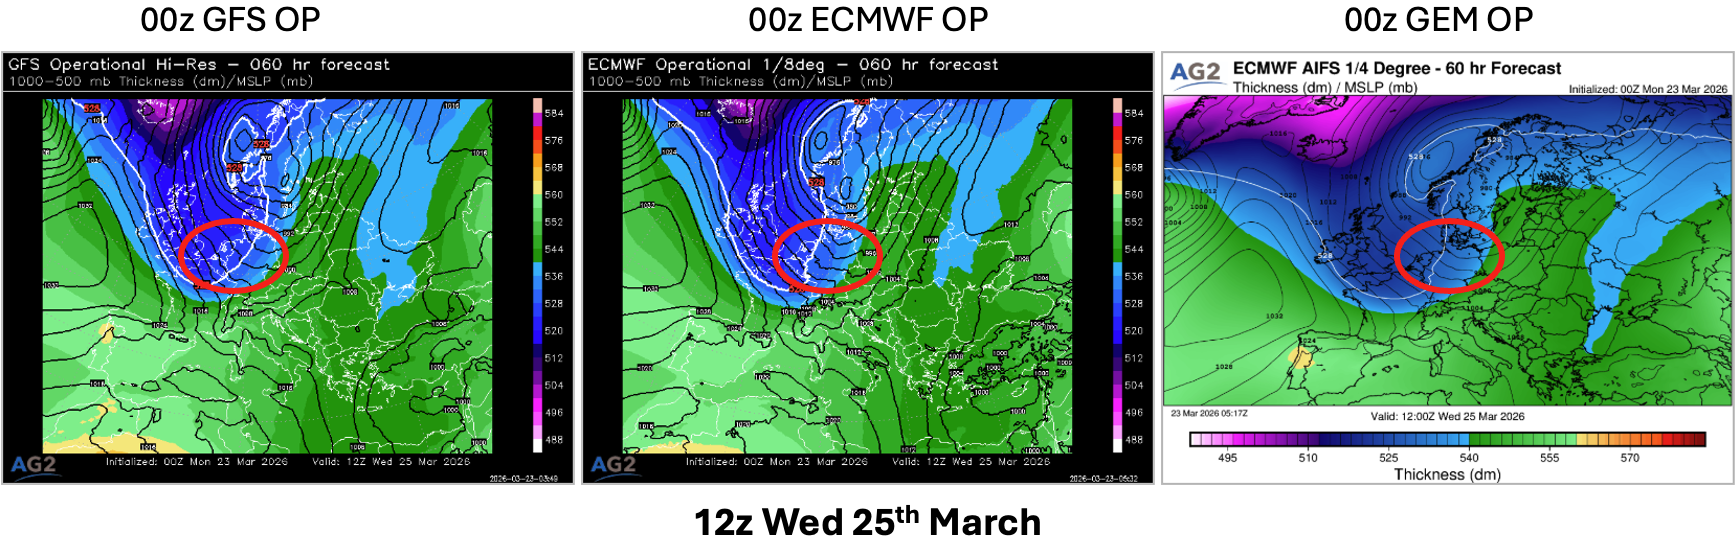
Then through the end of the working week, a gradual decline in German winds is forecast as a ridge of higher pressure builds in by Fri 27th March with winds dropping to lower levels:
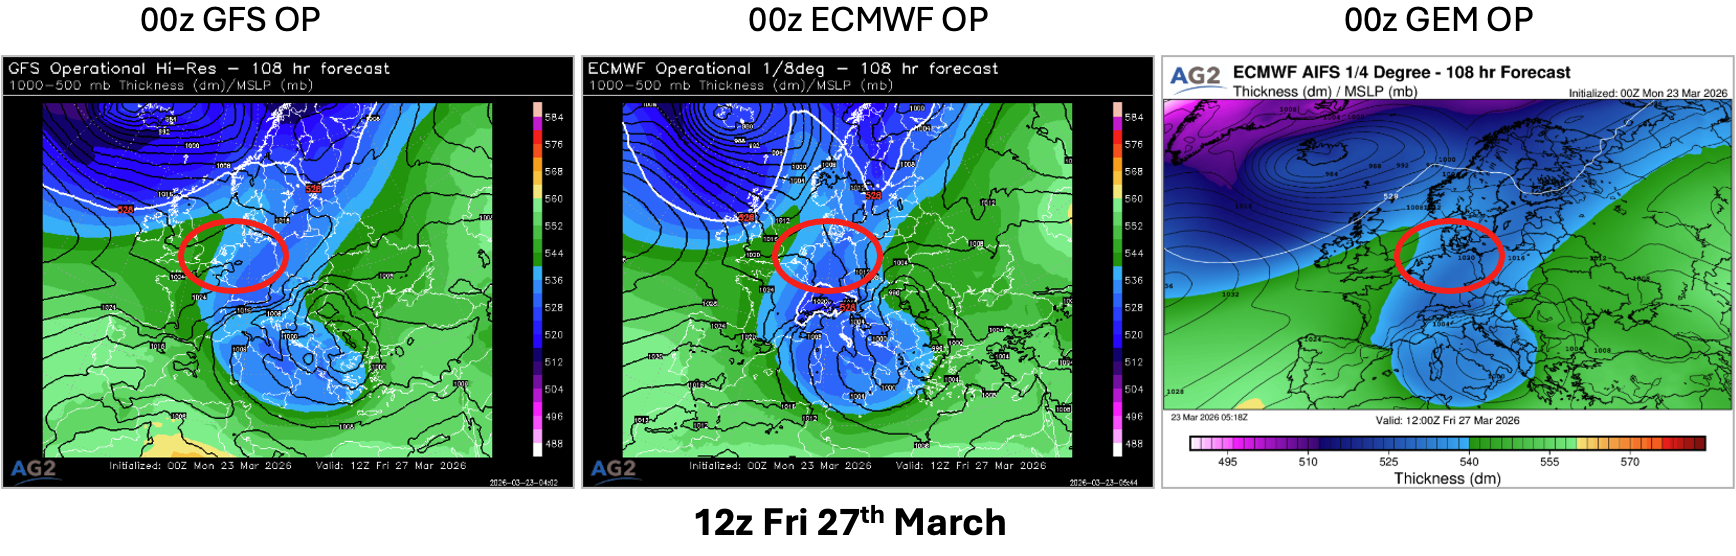
For week 14 (w/c 30th March), mostly moderate wind power potential is forecast for Germany due to the pressure gradient between higher heights to the west and lower heights to the north-east:
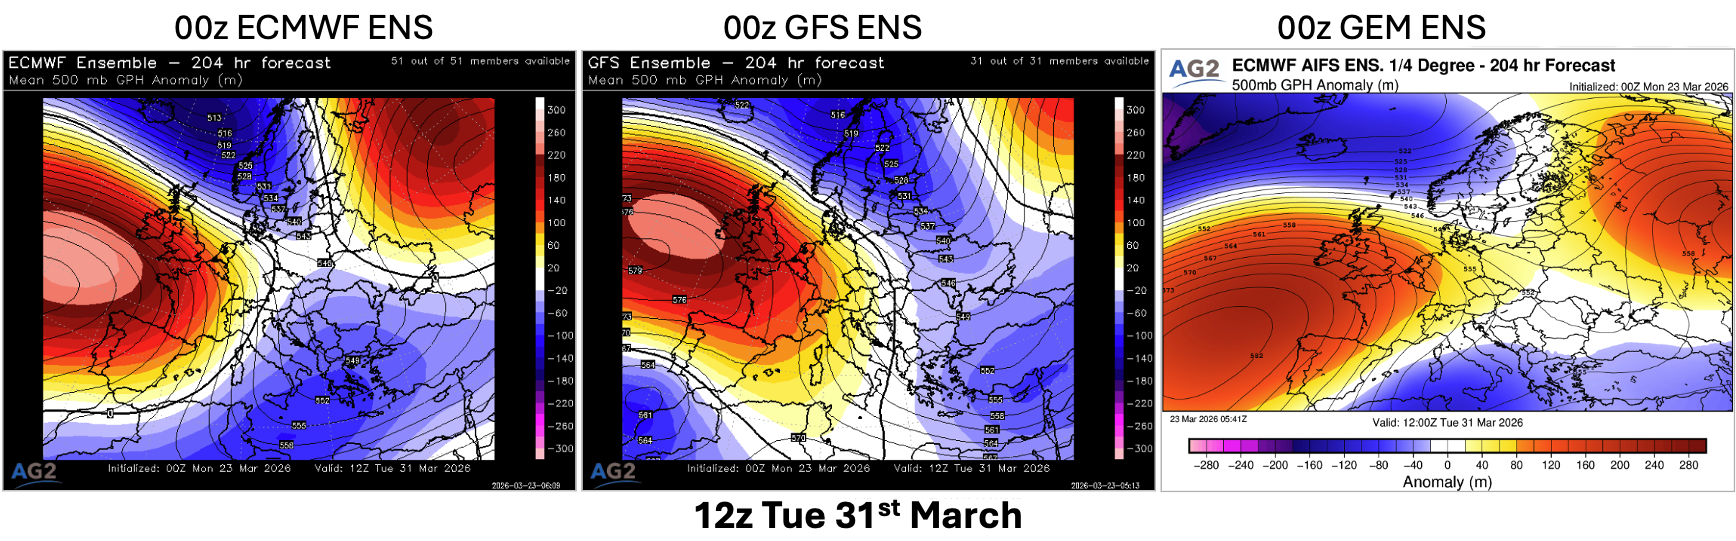
However through the end of week 14, higher pressure starts to try to extend north-eastwards. Therefore there is a downside risk to German wind power potential late week 14.
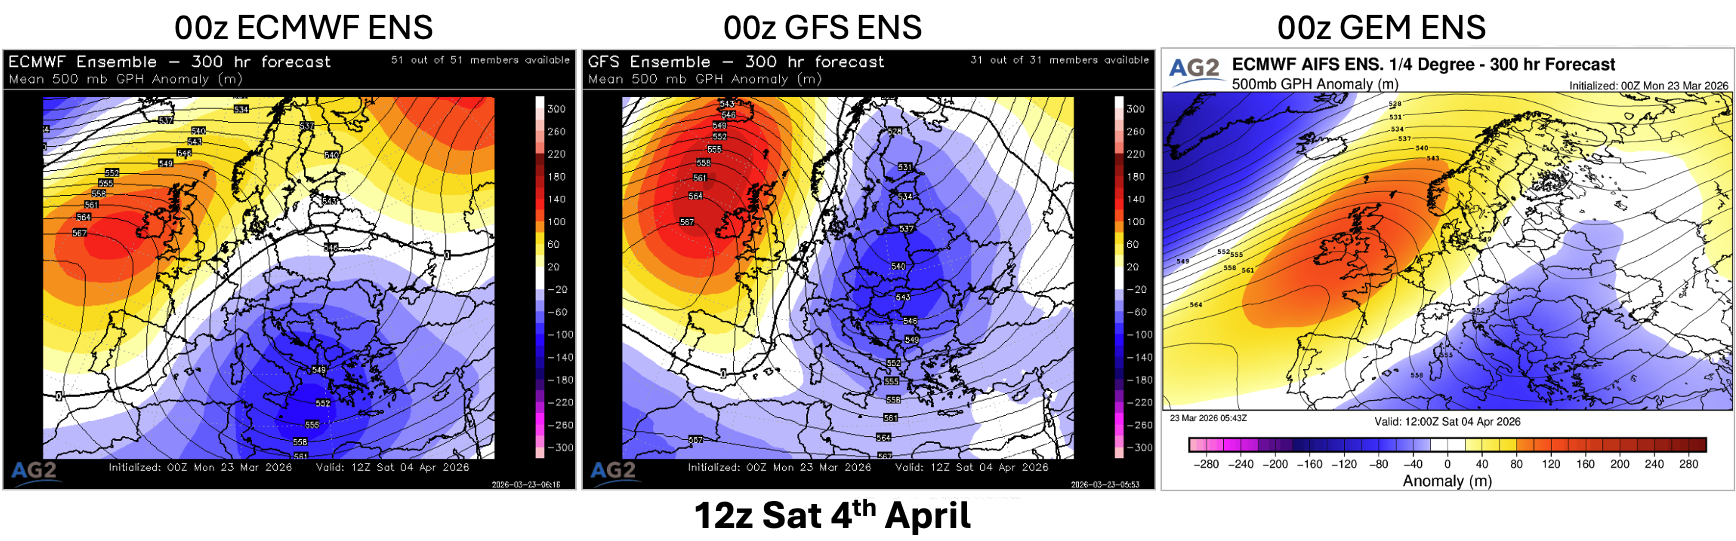
The latest EC46 then forecasts lower than normal wind power potential for Germany through weeks 15 and 16 under higher pressure.

Bottom line: A peak to high wind power potential for Germany this Wed 25th March in a strong northerly airflow off the North Sea, with peak levels forecast to reach mid 40GWs. Then through the end of this week, wind will drop back to lower levels as a brief ridge of high pressure moves in. For week 14, generally a moderate wind week is forecast to Germany in a decent pressure gradient between higher pressure to the west, lower pressure to the north-east. Risks appear more to the downside late week 14 as higher heights extend towards the north-east. Finally into weeks 15 and 16, the latest EC46 is forecasting low winds under higher pressure.
Published by: Amy Hodgson
The temperature forecast changes vs the previous forecast are shown below. Slightly milder across eastern Europe weeks 13 and 14. Otherwise, no significant changes.
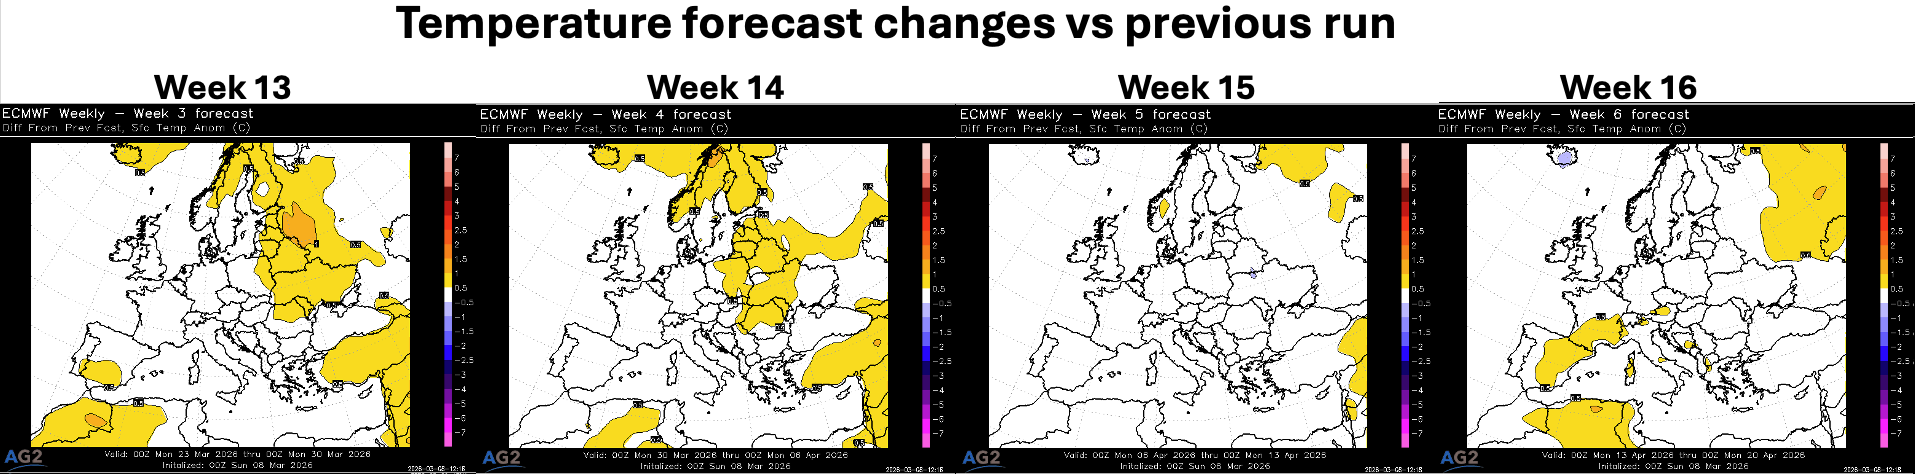
Week 13
Pattern: +NAO. Higher heights across north-eastern Europe with weak troughing across the south.
Temperatures: Widely above normal, highest anomalies to the north-east. Nearer normal temperatures across Iberia.
Hydro: Mostly near normal. Wetter to the far south-east.
Wind: Above normal northern Europe. Below normal southern Europe.
Solar: Mostly slightly above normal except below across the south-east.
Risk/confidence: Majority of EC46 clusters continue to support a mild week, although with differences in exact pressure pattern. Continued risk that potential MJO movement towards the western hemisphere and potential stratospheric impacts could come into play late March/early April giving colder risks to the forecast, but uncertainty lies in the strength of this large scale forcing.

Week 14
Pattern: -NAO. Higher heights across northern Europe, with weak troughing across southern Europe.
Temperatures: Above normal, highest to the east. With nearer normal temperatures to the south-west.
Hydro: Near normal to slightly drier than normal across northern Europe, wetter across the south.
Wind: Mostly near normal to slightly below normal.
Solar: Above normal across the northern half of Europe, below across the south.
Risk/confidence: Majority of EC46 clusters continue to favour a mild outlook but again differ in the exact details of the pattern. Trend towards a more blocked pattern/-NAO look seem reasonable with potential MJO and stratospheric impacts which could come into play late early April giving less mild/colder risks to the forecast.
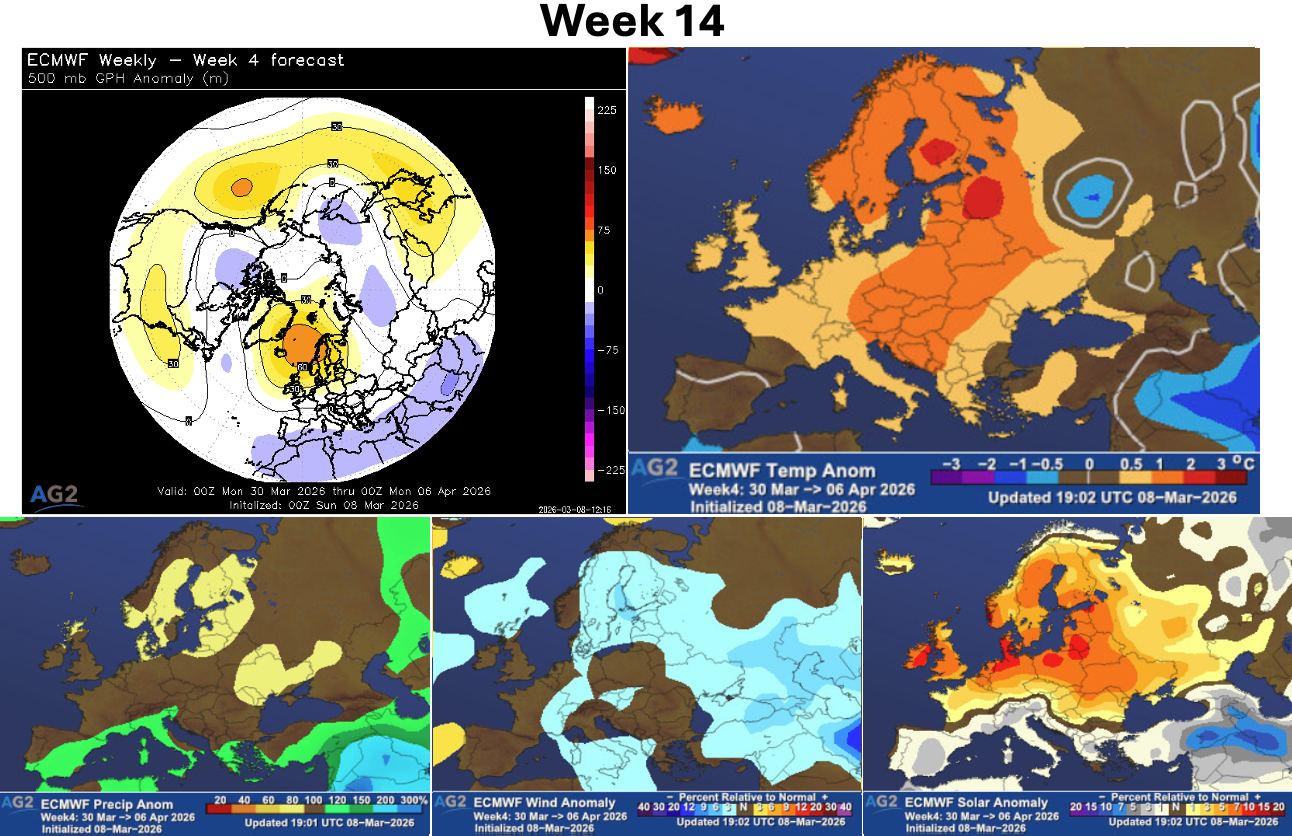
Week 15
Pattern: -NAO. Weak troughing across north-eastern Europe.
Temperatures: Mostly near normal to slightly above normal.
Hydro: Mostly near normal, slightly above across the north-east.
Wind: Mostly near normal. Slightly below to the south-west.
Solar: Mostly near normal to slightly above.
Risk/confidence: Confidence dropping with more variable clusters – top two present colder risks across northern Europe. Clusters do support a continuation of some sort of high latitude ridging but differ in the details.
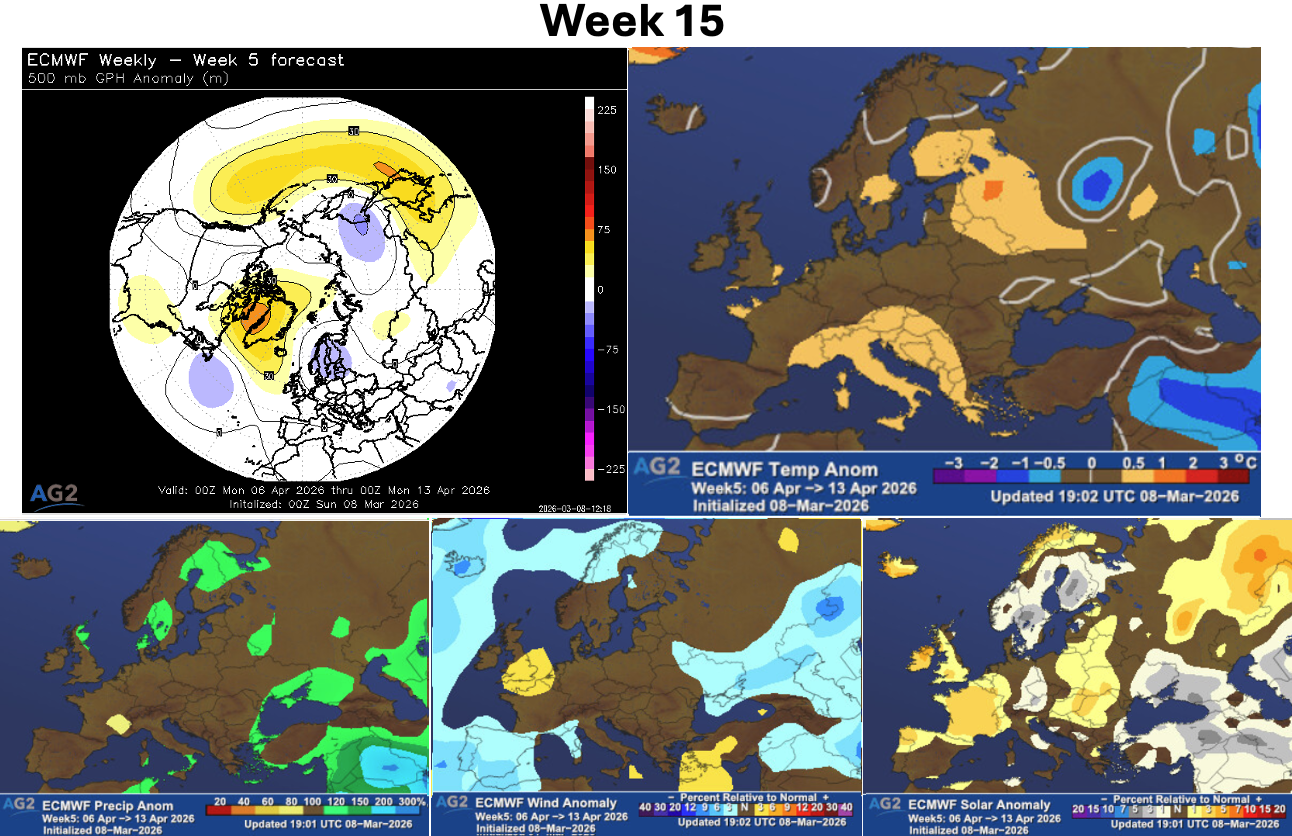
Week 16
Pattern: Weak -NAO with weak troughing across northern Europe, weak ridging across the south.
Temperatures: Slightly above across western and central Europe, nearer normal across the east.
Hydro: Mostly near normal. Slightly below eastern Iberia.
Wind: Mostly near normal. Slightly below Iberia.
Solar: Slightly above across western Europe and the Mediterranean. Below across eastern Europe.
Risk/confidence: Lower confidence with poor cluster agreement. Top two clusters (22% and 21%) bring back lower pressure to northern and western Europe. While third cluster (16%) persists with high latitude ridging.
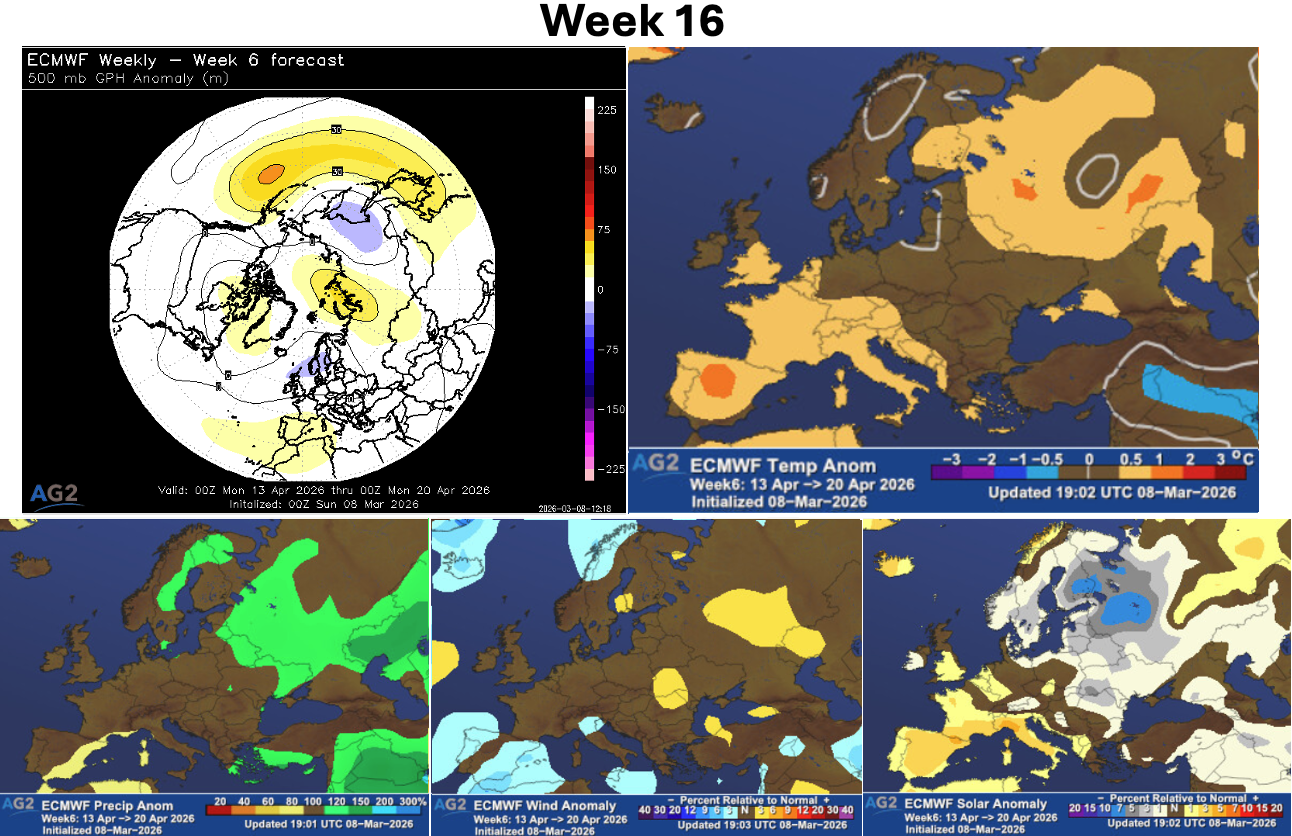
GFS Weekly:
The latest GFS weekly below is forecasting a -NAO pattern weeks 13 to 15 bringing higher pressure to northern Europe, and lower heights to southern Europe. Generally in broad agreement with the EC46 large scale pattern, although detail differences in the exact placement of higher heights to the north and lower heights to the south.

Bottom line: The latest EC46 and GFS weekly are in broad agreement in a more -NAO/high latitude ridging pattern developing through late March and into April. Temperatures are overall forecast to trend less mild, albeit remaining slightly above the seasonal normal in the latest EC46 guidance which would generally bring a more settled northern Europe and more unsettled southern Europe pattern. There continues to be some colder risks from clusters, alongside MJO forcing and potential stratospheric implications although confidence in the detail is low.
The satellite image from yesterday below, clearly shows the hazier skies across Iberia, the Mediterranean to Italy associated with the current Saharan dust outbreak:
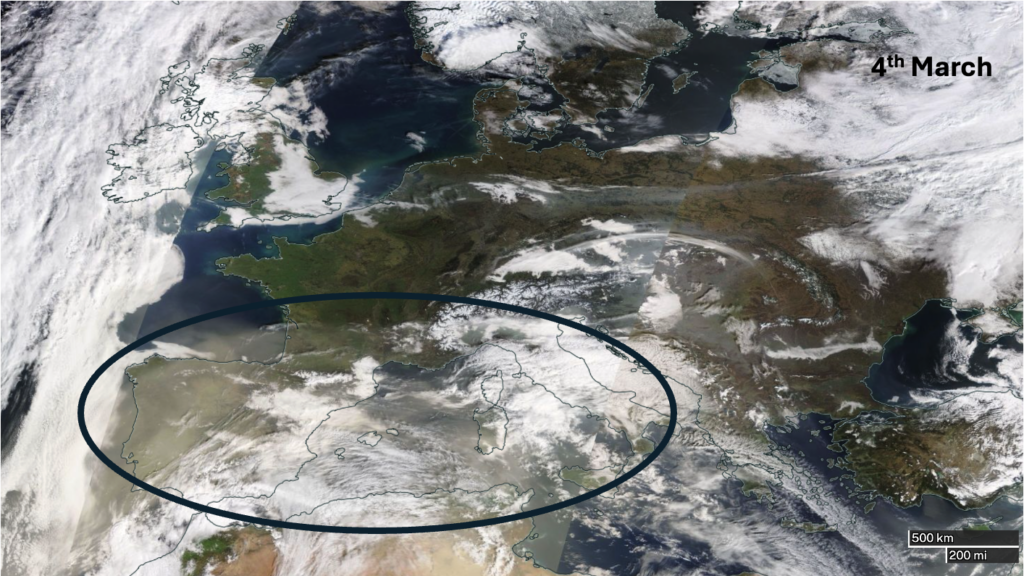
While the images below show the dustier skies now spreading across France towards the British Isles. Dust in the bottom image is shown by the pink shading.

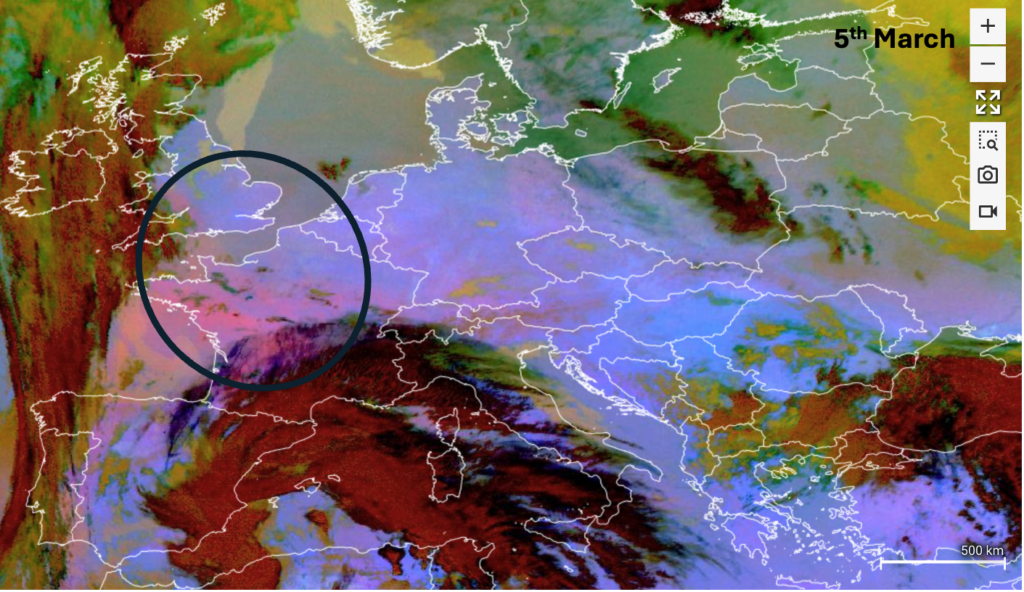
The latest dust load forecast from the University of Athens below shows the highest dust load currently across parts of Iberia, France to southern areas of the British Isles today, before then spreading to Benelux and Germany tomorrow. Through front weekend, dust levels are forecast to remain elevated across northern Europe.
The Barcelona Dust Regional Centre forecast to aerosol optical depth (AOD) below shows a similar pattern of higher levels spreading across northern Europe over the next few days.
So why Saharan dust important?
Saharan dust can have an impact on solar power generation both directly and indirectly. Directly, dust in the atmosphere blocks and scatters solar radiation from the sun, hence less incoming radiation hitting solar panels, thereby reducing generation. Dry deposition of the dust directly settling and building up on the panels will also reduce the power generation. Wet deposition, the process of removal of dust from the atmosphere by precipitation can also lead to dust build up on panels and reduced generation. Finally indirectly, Saharan dust in the atmosphere can act as cloud condensation nuclei (CCN), which is needed for clouds to form. Therefore dust in the atmosphere acting as CCN can lead to an increase in cloudiness, thereby reducing incoming solar radiation leading to a reduction in solar generation.
Risks are therefore to the downside for solar across Iberia, France and the British Isles today, with the main downside risks on Friday being across the British Isles to Benelux and Germany. Then through front weekend, slight downside risks across northern Europe.
This is a follow-up blog to an earlier article available at https://www.ag2trader.com/1-15days/?blogPostID=190084, taking it to the main large-scale driver for Europe in the sub-seasonal space this time of the year (MJO and Stratosphere). The MJO could be speeding up and, reinforced by a Kelvin Wave, could start stimulating a pattern transition into the back half of March towards lower NAO values, while the unfolding SSW in the background struggles to show clear footprints.
Tropical convection is forecast to emerge in the Atlantic basin into mid-March, and it has been monitored for a while for its potential to be a cold trigger for Europe. The latest projections suggest that such convections could be supported by active phases of both the MJO and a Kelvin Wave. If those two oscillation synchronize could provide a larger magnitude forcing as a consequence on to the NAO index.
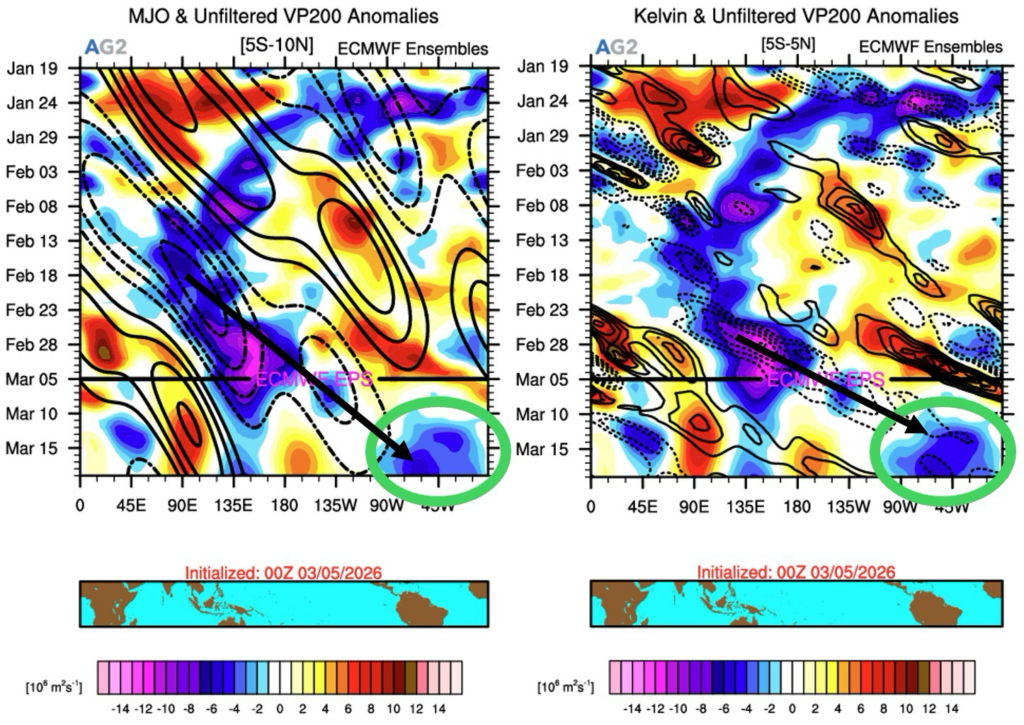
At the minute, as discussed in our previous blog, less +ve NAO conditions are forecast into W12. Based on the plots below, the risks is to see an increased downward forcing on that index W12+.
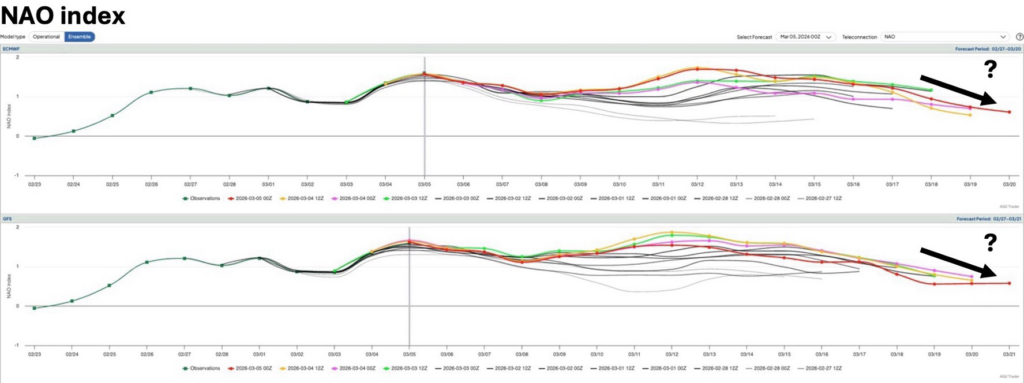
Compared to a couple of days back, the latest filtered velocity potential forecasts from ECMWF, show a quicker E’ward progression of tropical convection (some combination of MJO and Kelvin Wave) towards the Americas and the Atlantic. Quicker arrival of more organized convection into the Atlantic equals earlier and perhaps higher risks of seeing a colder or at least less mild shift in Europe.
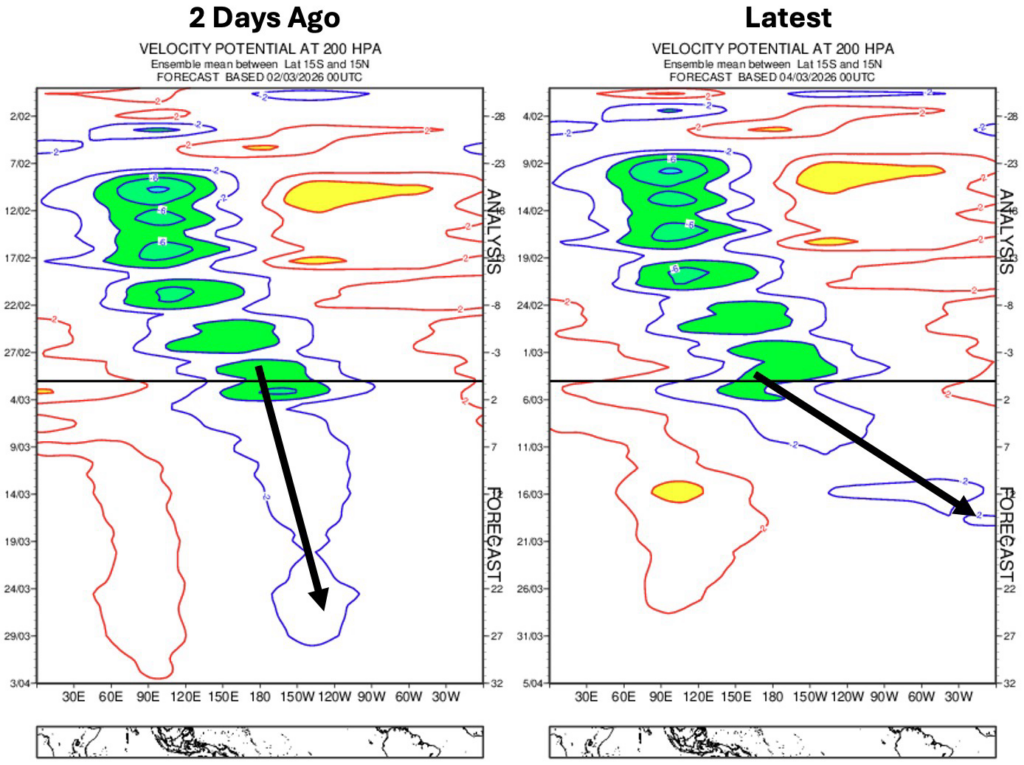
The wheeler diagrams presented below shows that while EC now brings the MJO into phase 8 (increased colder risks for Europe) later in March, GFS lingers behind over the Pacific. Quite some spread there…
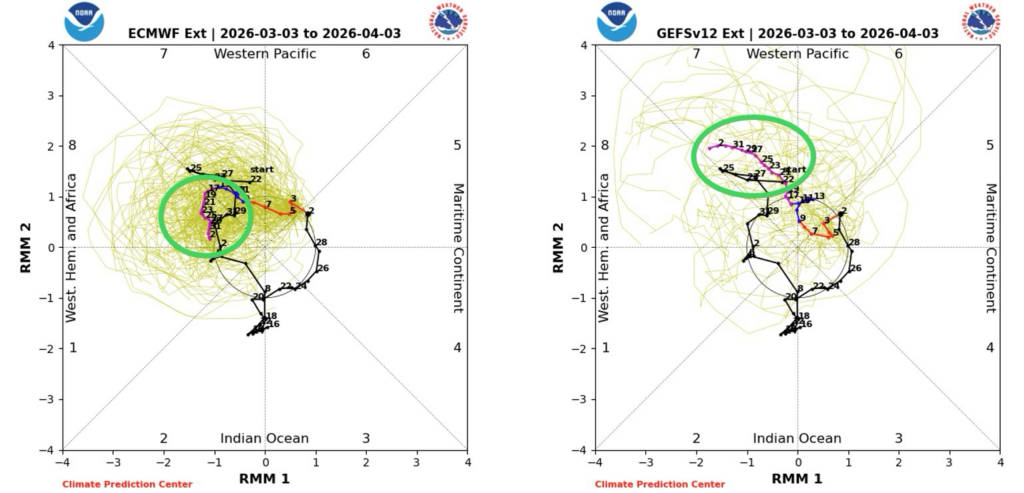
And obviously his highness, the Polar Vortex. A split-vortex type major SSW is unfolding.
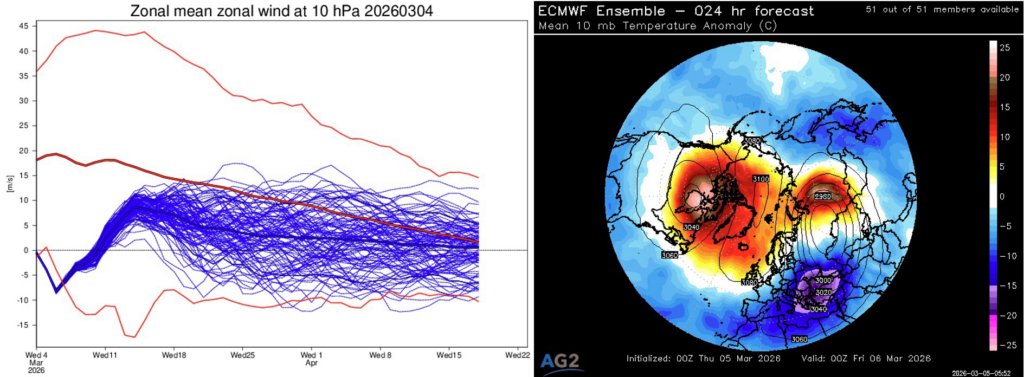
Anomalous warmth is forecast to rapidly propagate downward through the stratosphere, but coupling with the troposphere doesn’t look too impressive at the minute. We should not ignore longer wave downwelling either, which could extend the risks of seeing stratospheric forcing later in the month if not even further.
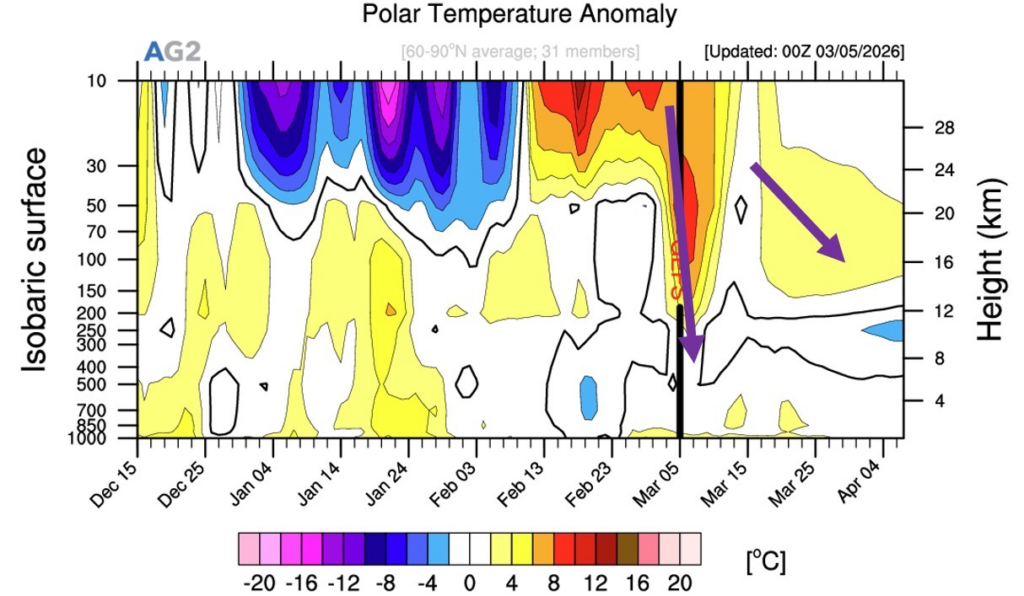
The AO forecast is the main detractor of a stronger stratosphere-troposphere coupling event. Tighter coupling would in fact skew the AO towards negative values, while the latest projections resolve an overall +AO through the next couple of weeks, limiting the Arctic’s propensity to open its cold-air taps for now.
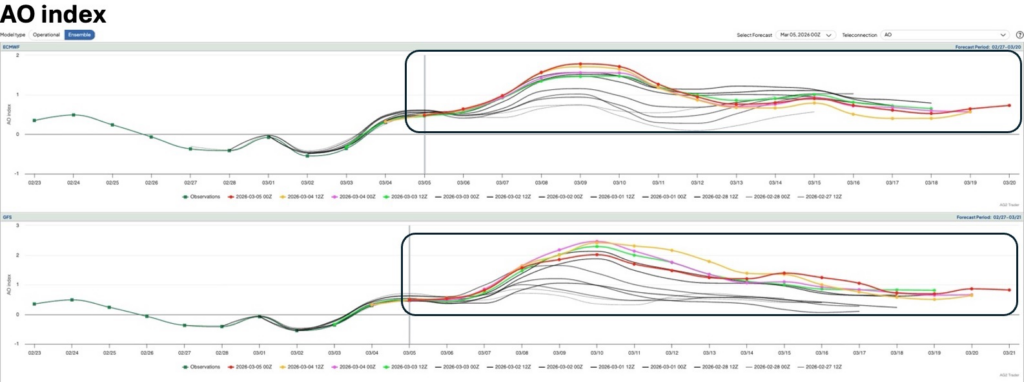
Bottom Line: The latest EC projections show a quicker E’ward propagation of the MJO towards the Atlantic by mid-month. If this is confirmed and aligns with a Kelvin Wave also reaching the Atlantic in a similar timeframe, we could see colder/less mild risks increase for Europe W12+, along with a descent of the NAO index. Meanwhile, an unfolding split-vortex type major SSW in the background also suggests colder risks through March if not beyond, while an AO seemingly locked in a +ve phase would limit the supply of colder air. We should however closely monitor any further MJO evolution now and as well as any potentially tighter coupling between stratosphere and troposphere for clearer signals towards stronger forcing to a pattern shift in Europe later in March.
Latest observations show that snowpack is below normal across most of Japan. Areas with above-normal snow are limited to parts of Hokkaido and northern Tohoku.
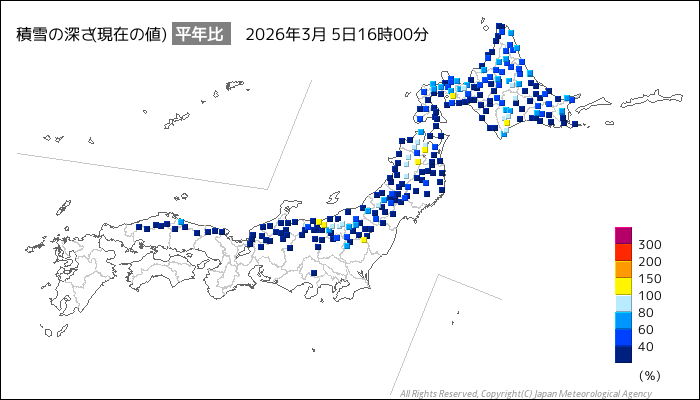
Reservoir storage is also low, with many dams sitting below 50% capacity, reflecting the dry winter conditions.
Precipitation over the next two weeks is very likely to remain below normal, and there is no strong signal for above-normal rainfall even out to around five weeks.
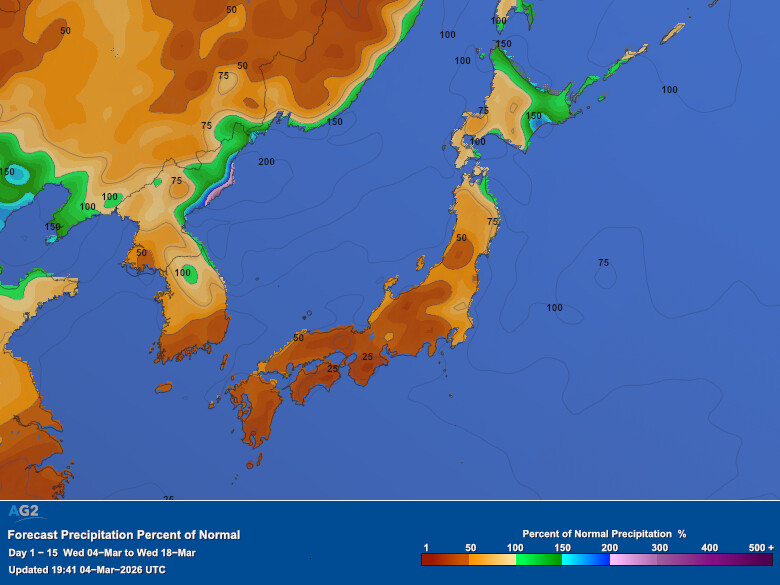
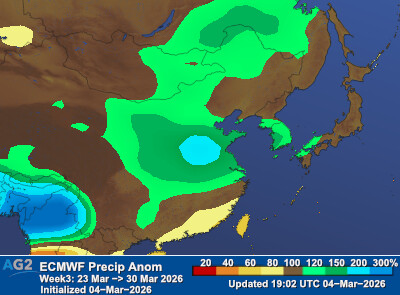
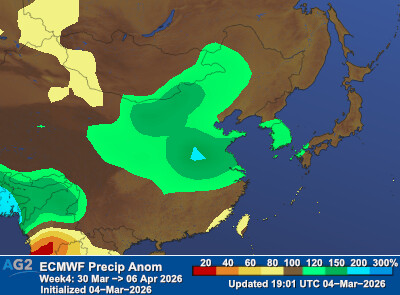
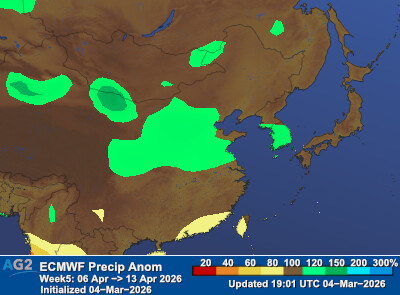
At the same time, the 3-month temperature outlook is near to above normal, suggesting earlier-than-usual snowmelt in mountain areas.
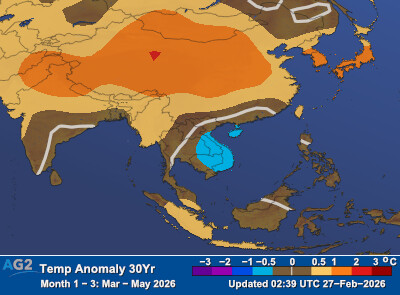
This creates a mixed hydro picture: earlier snowmelt could temporarily support hydro generation in March–April, but if rainfall remains limited into May and beyond, inflows may weaken and hydro availability could decline later in spring.
Summary
East Asia saw a broadly warm month, driven by a relatively mild upper-level pattern despite occasional cold intrusions. Over Japan, low- and high-pressure systems moved through in a fast cycle, and winter monsoon conditions did not persist for long. Early in the month, a brief but strong winter pattern pushed cold air south, producing heavy snowfall across the Sea of Japan side and, locally, the Pacific side. Mid-to-late month was generally dry as storm tracks were limited, before more organized rain arrived later, especially across northern/eastern Pacific-side Japan and western Japan. Temperatures were notably above normal across northern/eastern Japan and eastern/southern China. Solar conditions were generally favorable outside northern China.
Synoptic pattern
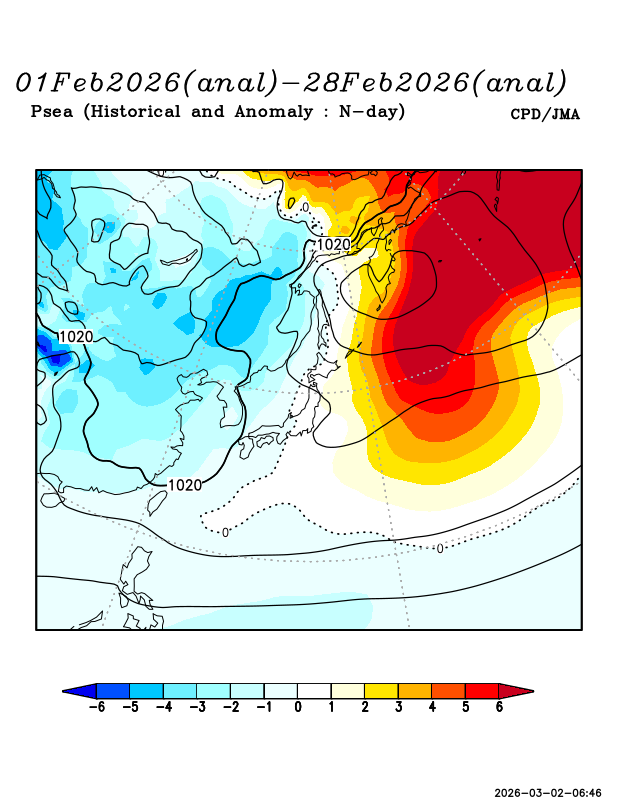
Low- and high-pressure systems moved through from China toward Japan in a recurring cycle. In Japan, winter-monsoon (“winter-type”) patterns did not persist for long, and there were periods dominated by mobile high pressure. Early in the month, a brief but strong winter pattern pushed cold air south, bringing heavy snow mainly to the Sea of Japan side of eastern and western Japan, with localized heavy snow also on the Pacific side.
Through the first part of the late month, storm and frontal impacts were limited and precipitation stayed generally low. From mid-to-late month, lows and fronts became more active again, bringing more organized rainfall, especially across northern/eastern Pacific-side Japan and western Japan.
Upper-level pattern (500mb GPH) and temperature anomalies
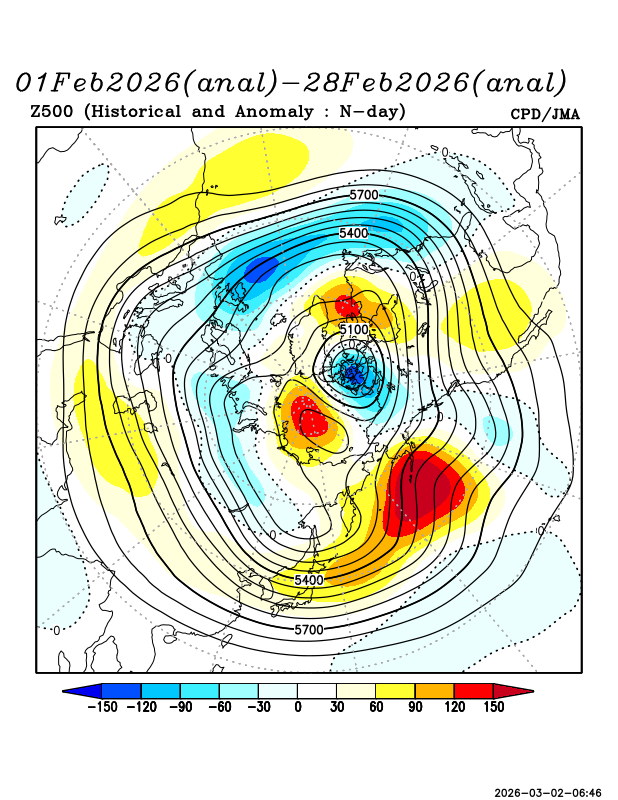
The polar-front jet occasionally dipped south near northern Japan, allowing some cold intrusions. However, 500mb height anomalies were often positive near Japan, limiting sustained upper-level cold influence. At the surface, both the Aleutian Low and the Siberian High were relatively weak.
Temperature
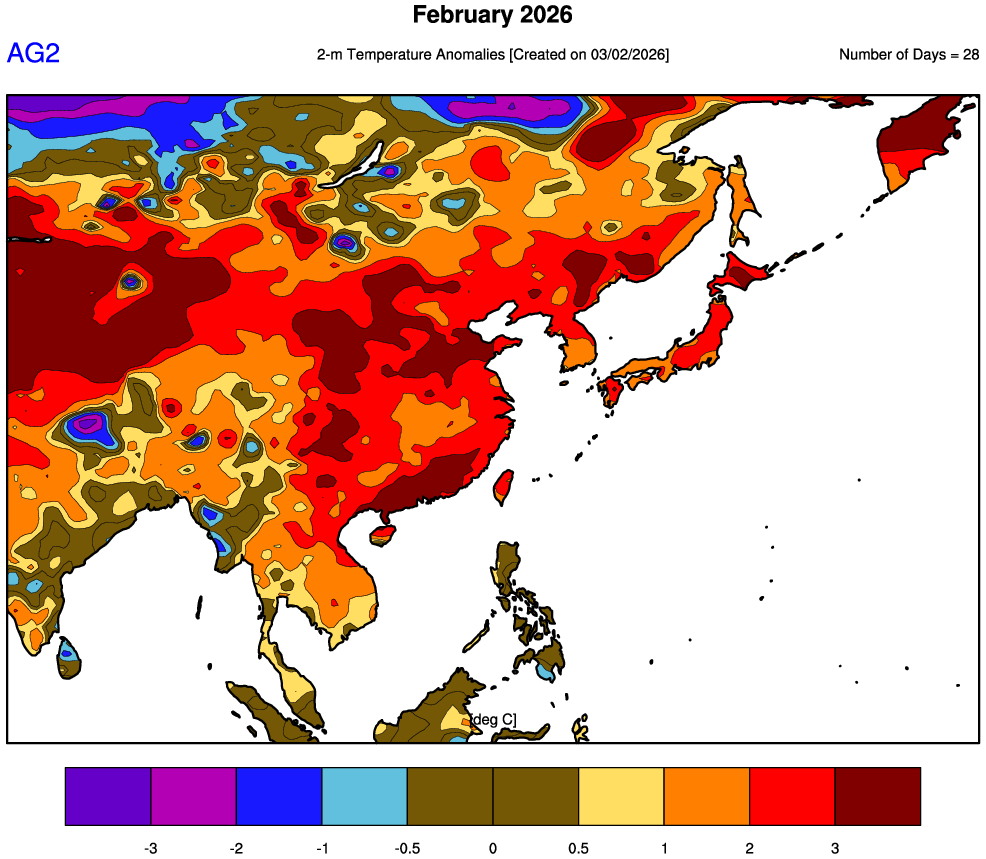
Temperatures were above normal across much of East Asia, with the strongest warm anomalies over northern/eastern Japan and eastern to southern China.
Precipitation
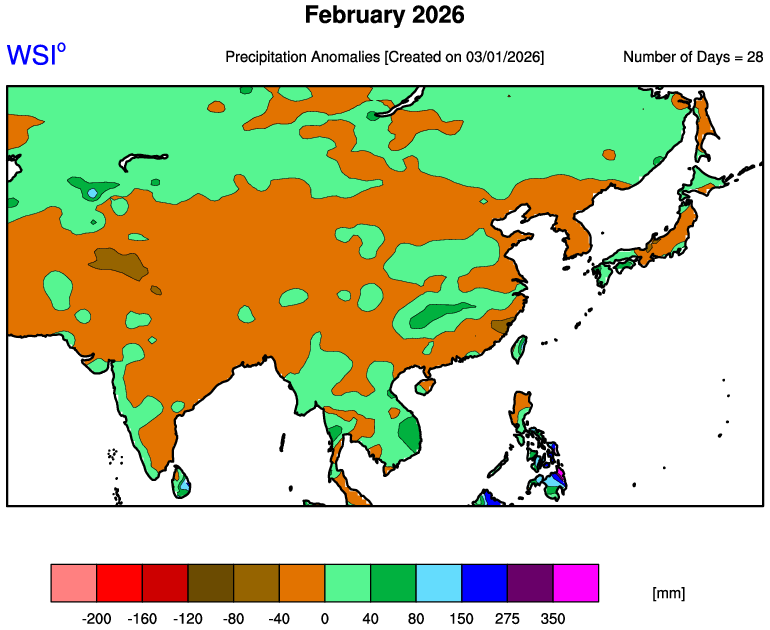
Precipitation was above normal in northern Japan, western Japan, Northeast China, and parts of eastern China, while eastern Japan, South Korea, and southern China were drier than normal.
Wind
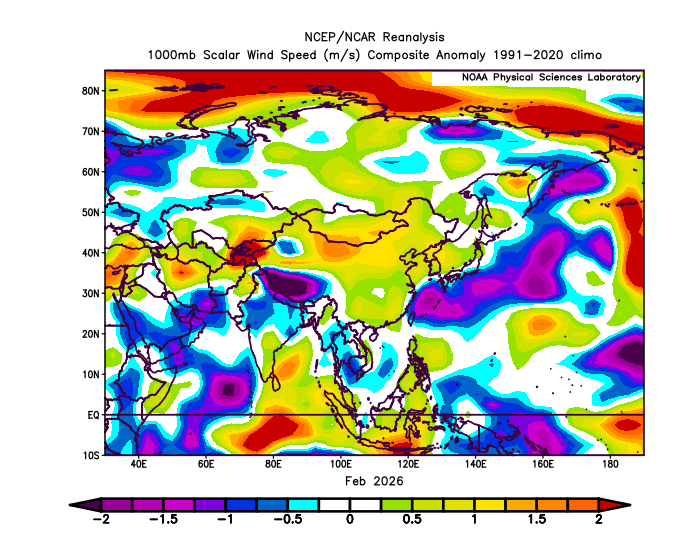
Winds were stronger than normal in China, South Korea, and parts of northern Japan, while the Pacific side of Japan and the Okinawa region were relatively lighter.
Solar radiation / cloud cover
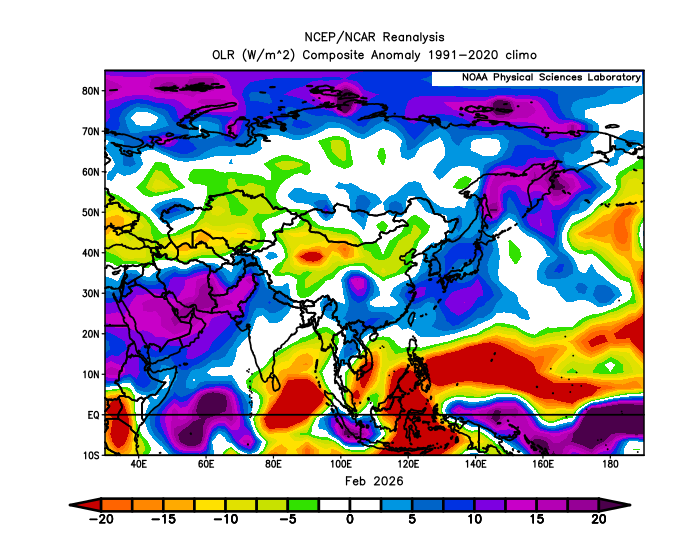
Solar conditions were favorable across Japan, South Korea, and eastern/southern China, while northern China saw slightly weaker solar due to cloudier conditions.
Archives
- January, 2026: https://www.ag2trader.com/1-15days/?blogPostID=189802
- December, 2025: https://www.ag2trader.com/1-15days/?blogPostID=189480