
PJM by AG2
Forecast Solar & Wind > See NetLoad > Trade the risk
AG2 provides PJM-focused forecasting products for load, solar, and wind. Together, these services give clients a more complete view of demand, renewable generation, and NetLoad risk across the PJM footprint. The PJM Load Forecast helps clients understand future electricity demand, while PJM Solar and PJM Wind help quantify renewable generation that can materially change residual demand and market conditions.
PJM Fliers and White Papers
AG2 PJM FAQ
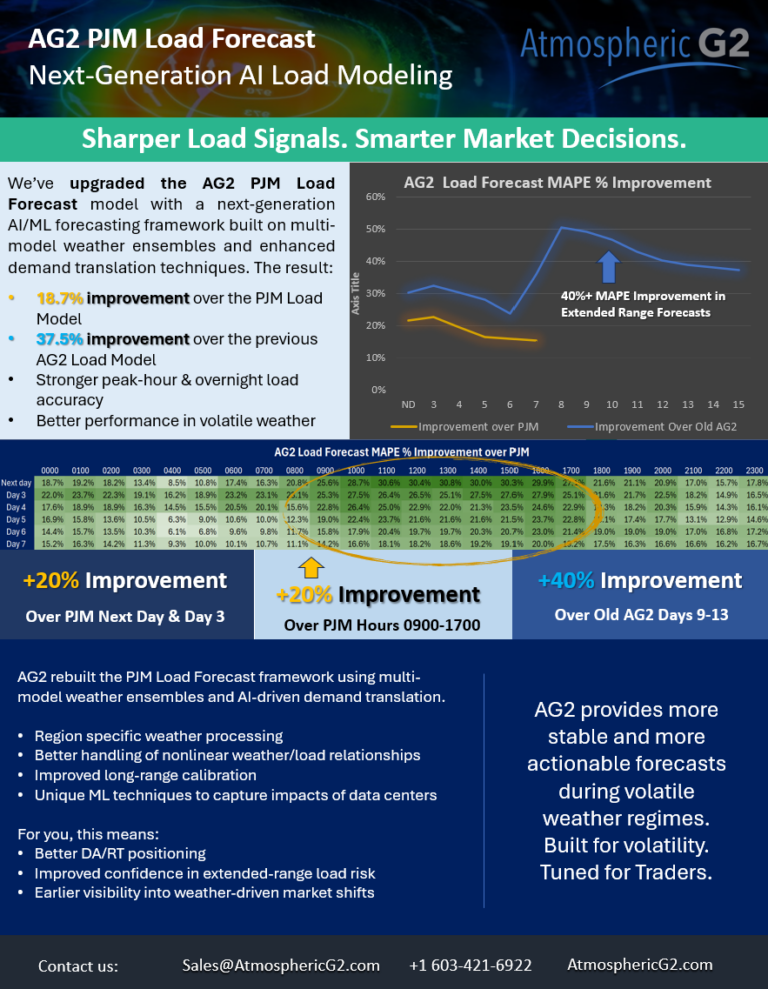
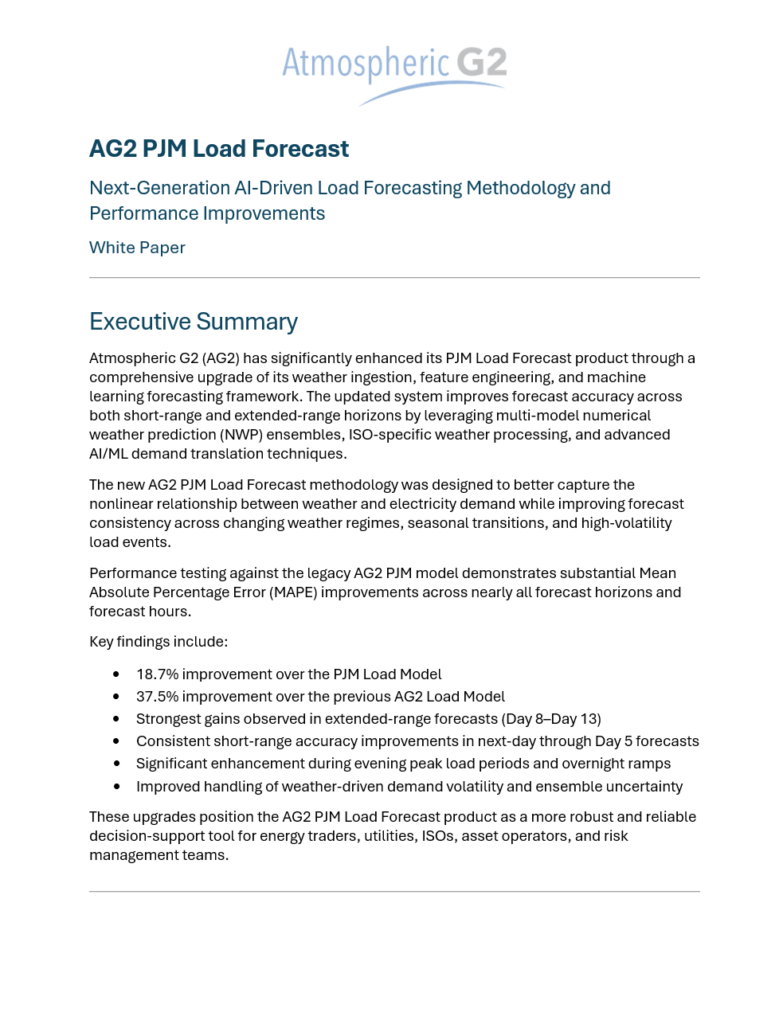
AG2’s PJM Load Forecast uses a next-generation AI-driven methodology that combines multiple numerical weather prediction models, PJM-specific weather processing, advanced feature engineering, and machine learning demand translation. The model is designed to better capture the nonlinear relationship between weather and electricity demand, especially during high-impact weather events, seasonal transitions, and volatile load periods.
According to AG2’s model evaluation, the upgraded PJM Load Forecast achieved an 18.7% improvement over the PJM Load Model and a 37.5% improvement over the previous AG2 Load Model. The strongest gains were seen in extended-range forecasts, with additional improvement during evening peak periods, overnight ramps, and weather-sensitive demand events.
The PJM Load Forecast supports short-range, medium-range, and extended-range forecasting. The upgraded model was evaluated across forecast horizons from next-day through Day 15, allowing clients to use the forecast for day-ahead planning, near-term operations, and longer-range risk management.
PJM load forecasting is complex because demand is influenced by a large and diverse geography, rapid weather changes, seasonal transitions, population density differences, weather-sensitive consumption patterns, growing renewable penetration, and increasing demand from data centers. AG2’s methodology addresses these challenges by using weather-aware, ISO-specific, AI-driven modeling.
Two things: 5-day forecasts vs. 2-day forecasts, and sub-regional views.
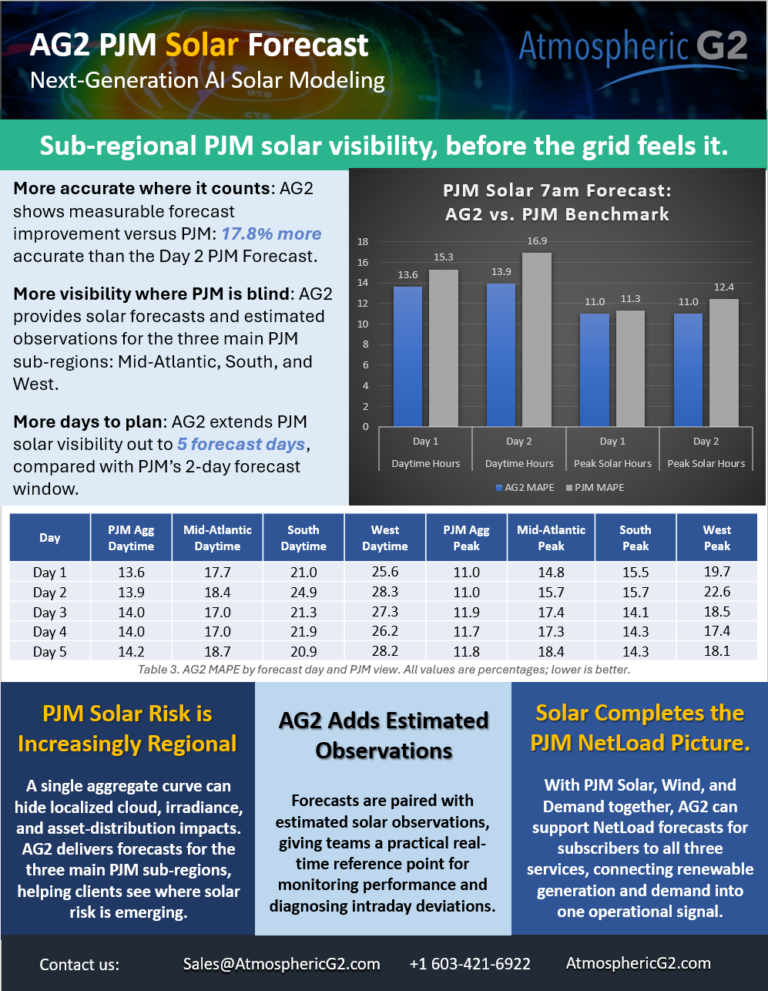
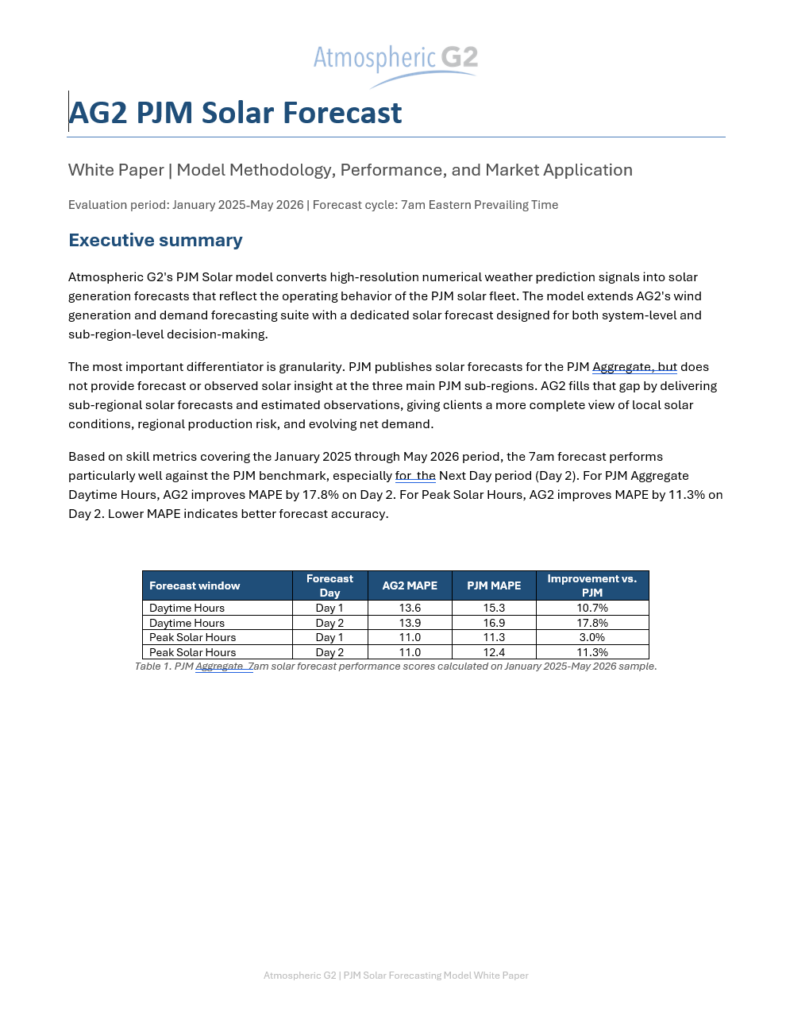
AG2’s PJM Solar Forecast provides both system-level and sub-region-level solar generation forecasts. A key differentiator is that AG2 provides forecasts for the three main PJM sub-regions, while PJM does not currently provide forecast or observed solar insight at that sub-region level. This gives clients more visibility into where solar production risk is emerging across PJM.
Yes. In addition to PJM solar forecasts, AG2 provides estimated solar observations. These estimated observations give clients a practical real-time reference point for monitoring solar performance, diagnosing intraday deviations, and understanding whether forecast error is localized or broad-based.
In the January 2025 through May 2026 evaluation period, AG2’s 7am PJM Solar Forecast performed especially well against PJM on Day 2. For PJM/Zonal Daytime Hours, AG2 improved MAPE by 17.8% on Day 2. For Peak Solar Hours, AG2 improved MAPE by 11.3% on Day 2. Lower MAPE indicates better forecast accuracy.
Day 2 is important because it is far enough ahead to support market positioning, next-day scheduling, and risk planning, while still close enough for weather-driven uncertainty to be actionable. Stronger Day 2 solar performance can help clients better anticipate renewable-driven changes before they affect operations or market exposure.
Solar risk is not always uniform across PJM. Cloud cover, irradiance variability, snow cover, seasonal sun angle, and regional asset distribution can cause one part of the footprint to behave differently from another. A single PJM-wide solar number can mask important regional deviations. AG2’s sub-region forecasts help clients see where solar generation may overperform or underperform.
NetLoad is demand after accounting for renewable generation such as wind and solar. It is an important operational and market signal because renewable output can significantly change the amount of load that must be served by dispatchable generation. By combining PJM Load, PJM Solar, and PJM Wind, AG2 can help clients understand the complete renewable-and-demand picture for PJM.
Yes. With the release of PJM Solar alongside AG2’s PJM Wind and PJM Demand forecasts, AG2 can provide PJM NetLoad forecasts for clients who subscribe to all three services. This allows clients to view demand, renewable generation, and residual load risk through one integrated forecasting framework.
AG2’s PJM forecasts are designed for energy traders, utilities, schedulers, asset operators, renewable analysts, risk managers, and large energy users. These products support day-ahead and real-time market decisions, generation scheduling, congestion risk assessment, renewable monitoring, and broader operational planning.
Weather is central to both load and solar forecasting. For load, AG2 processes variables such as temperature, dew point, humidity, wind, cloud cover, solar radiation proxies, heating relationships, cooling relationships, and multi-day weather stress indicators. For solar, AG2 processes irradiance, cloud cover, solar geometry, time-of-day effects, seasonal patterns, and solar fleet distribution. These weather signals are translated into MW-level forecasts using machine learning models trained on historical behavior.
AG2’s PJM forecasting suite helps clients improve market awareness, reduce operational uncertainty, better anticipate weather-driven volatility, monitor renewable generation risk, and understand how load, wind, and solar combine to influence NetLoad. The result is a more complete view of PJM supply-demand conditions from one forecasting provider.
Clients can use PJM Load to understand expected demand, PJM Solar and Wind to understand renewable generation, and NetLoad to see the combined market impact. This integrated view is especially valuable when weather conditions drive both demand volatility and renewable uncertainty at the same time.